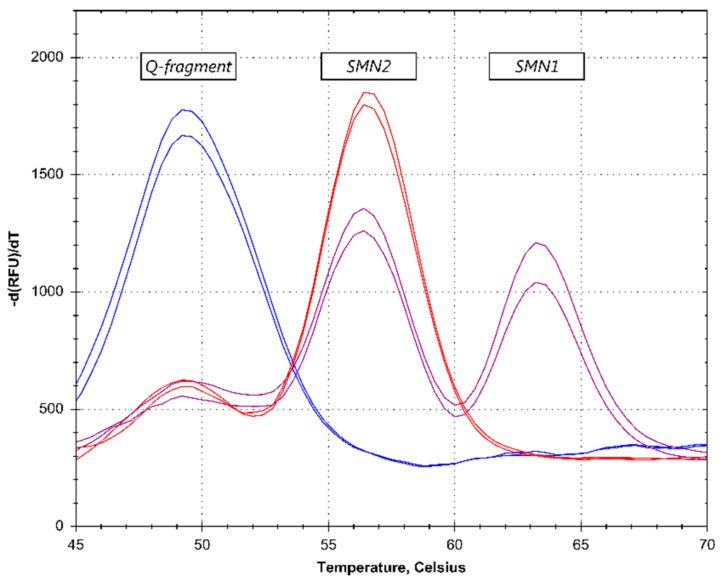
Figure 2.
Patient identification—melting curve (MC) results. The purple lines represent normal samples, as determined by the presence of an SMN1 peak. The red lines show an absence of an SMN1 peak, identifying a spinal muscular atrophy (SMA) patient. The blue lines represent no DNA control reactions, which results in a high quantity (Q)-fragment. The profiles were acquired on the CFX96 Touch PCR-platform.

