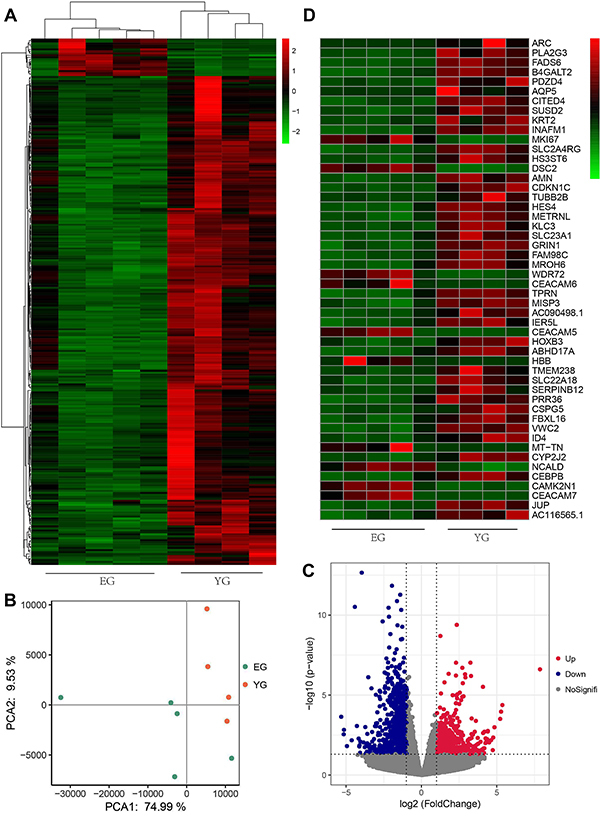
Figure 3. Differentially expressed genes (DEGs) between the young group (YG) and elderly group (EG) groups identified by RNA-seq analysis. A, Heatmap and hierarchical clustering analysis. The colors red to green represented the gene expression level. B, Results of the principal component analysis: orange dots represent samples of the YG group (n=4) and the cyan dots represent the EG group (n=5). C, A volcano plot of DEGs. Up- and downregulated DEGs with P <0.05 and a fold change >2 are represented in red and blue, respectively. D, The heatmap shows the top 50 DEGs with significant differential expression from panel C.

