Fig. 4.
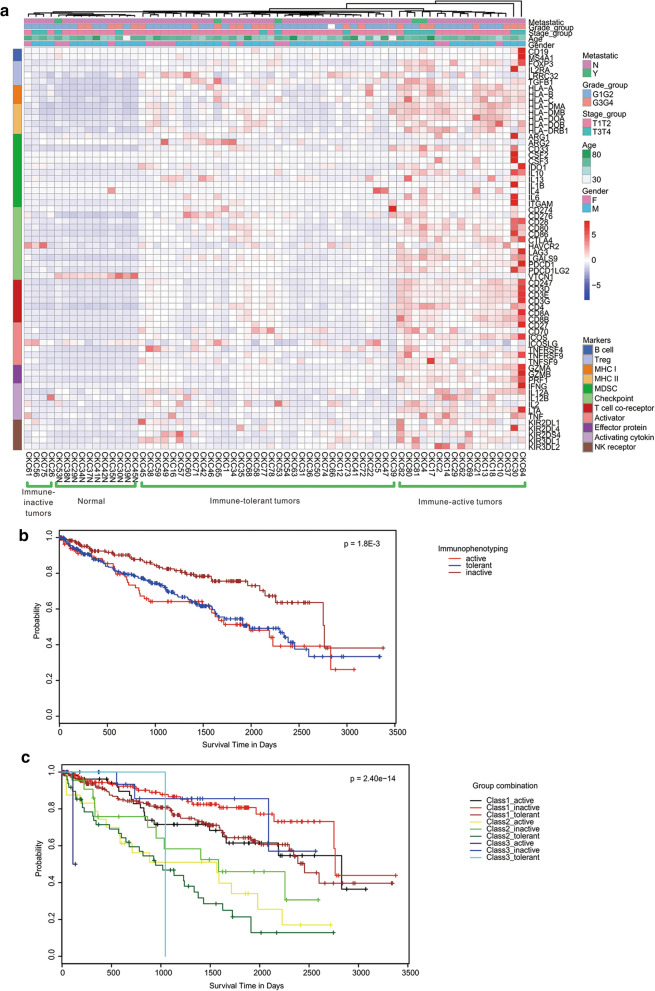
Transcriptional Characterization of Immune Microenvironment of ccRCC. a Unsupervised hierarchical clustering of immune gene expression within CccRCC patients (including tumor and normal samples, n = 66). A signature of 66 immune related cell markers proposed by TCGA was used for clustering. b Survival analysis on TCGA ccRCC patients (n = 533) grouped by three identified immuno-phenotypes (immune-active, tolerant and inactive) revealed significant difference. The log-rank test p-value across groups is 1.8E−3. c Survival analysis on combination of classification. TCGA patients were grouped by combination of molecular classification from Fig. 3 (Class 1–3) and immuno-phenotyping (immune-active, tolerant and inactive). The log rank test p-value across groups is 2.40E−14

