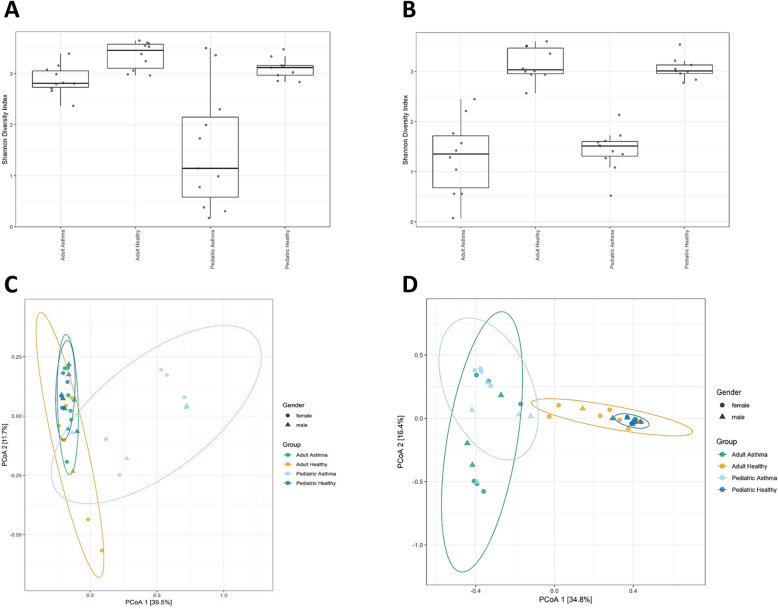
Fig. 1.
Lung microbiota of asthmatic subjects show lower levels of richness and complexity compared to healthy subjects. Evaluation of the alpha- and beta- diversity in the 40 analyzed samples. Panel showing alpha-diversity (Shannon index) computed and illustrated for each sample. ANOVA test determined significant differences in the Shannon diversity index based on different groups for bacterial data at p < 0.002 (a) and fungal data at p < 0.000 (b). To obtain a graphical representation of microbiome composition similarity among samples and beta-diversity, we summarized OTU abundances into Bray-Curtis dissimilarities and performed a PCoA ordination. Permutational analysis of variance (adonis R function, or Permanova) determined significant differences in beta-diversity among groups for bacterial data at p < 0.0009 (c) and fungal data at p < 0.0001 (d)

