
Figure 2.
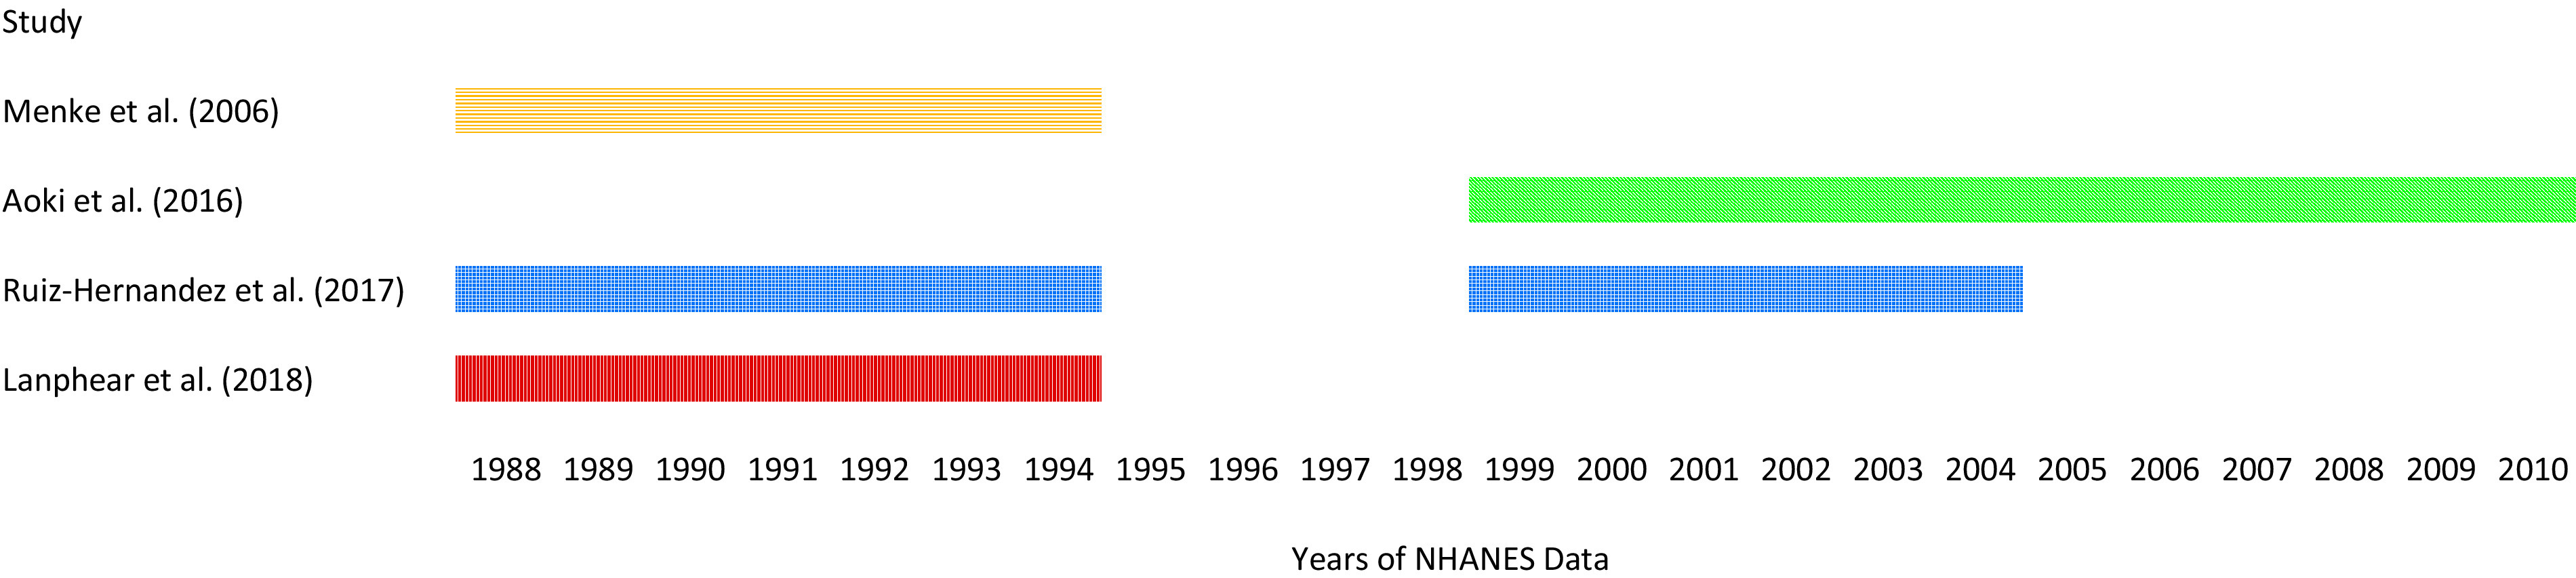
Years of NHANES data included in each study identified for use in the HIM. Note: NHANES, National Health and Nutrition Examination Survey.
Official websites use .gov
A
.gov website belongs to an official
government organization in the United States.
Secure .gov websites use HTTPS
A lock (
) or https:// means you've safely
connected to the .gov website. Share sensitive
information only on official, secure websites.
Years of NHANES data included in each study identified for use in the HIM. Note: NHANES, National Health and Nutrition Examination Survey.