. 2020 Sep 23;128(9):097005. doi: 10.1289/EHP6552

Figure 3.

Figure 3 is a graph, plotting Study, Menke and others (2006), Aoki and others (2016), Lanphear and others (2018), All participants, Lanphear and others (2018), Participants with B L L less than 5 micrograms per deciliter, and Ruiz-Hernandez and others (2017; y-axis) across Increased Risk of Cardiovascular Diseases Mortality per Unit Change in Blood Lead, ranging from 0 to 0.009 in increments of 0.001 (x-axis).

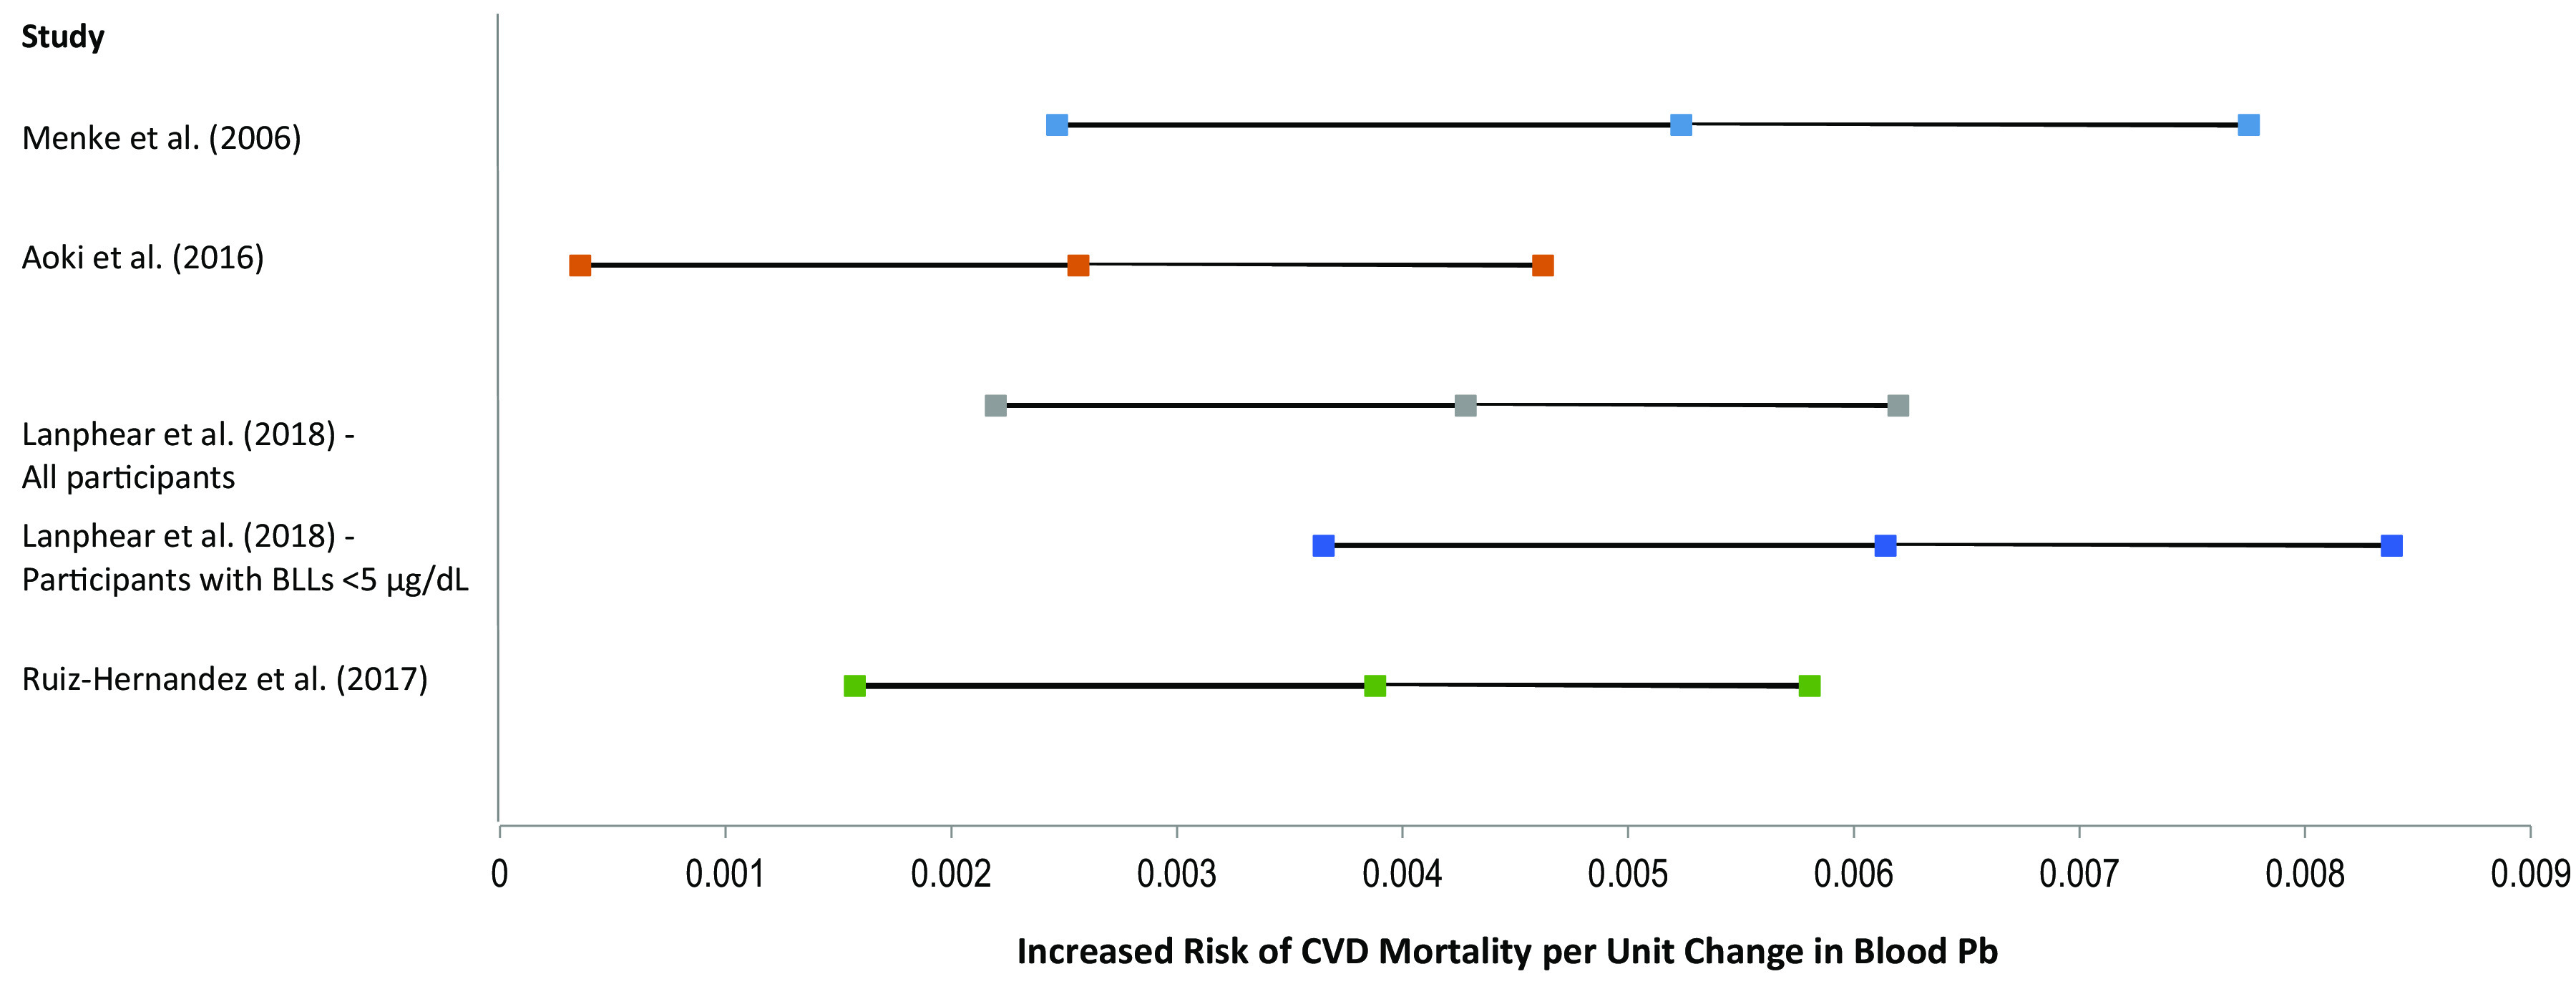
Increased risk of CVD mortality (central estimate and 95% CI) per unit change in blood Pb (Menke et al. 2006; Lanphear et al. 2018; Ruiz-Hernandez et al. 2017) or hematocrit-corrected blood Pb (Aoki et al. 2016). Note: CI, confidence interval; CVD, cardiovascular disease; Pb, lead.