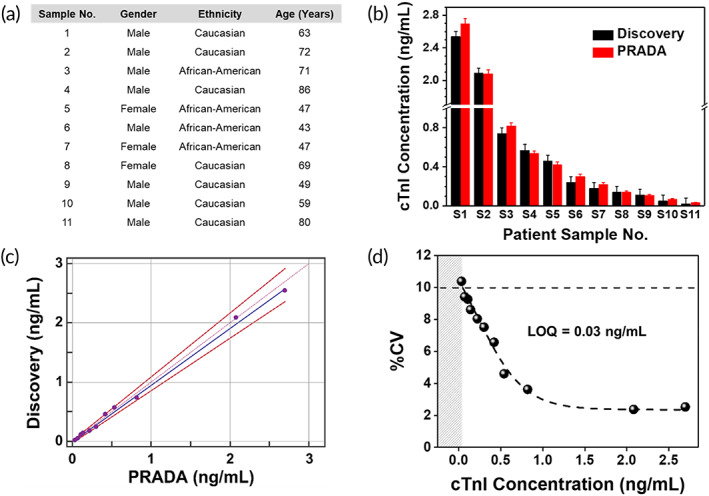
FIGURE 5.

PRADA for cardiac patient sample analysis. (a) Demographics of 11 patient samples purchased from Discovery Life Sciences including their gender, race, and age, and the cTnI levels. (b) Comparison of cTnI determined with PRADA and those obtained from Discovery Life Sciences measured using the ABBOTT ARCHITECT chemiluminescence assay system. The standard errors in Discovery data were <0.06 ng/ml. Error bars in SERS data indicate the standard deviations from at least five measurements. (c) Passing‐Bablok regression analysis between PRADA and Discovery Life Sciences to determine accuracy of PRADA. (d) %CV corresponding to mean cTnI concentrations for the 11 patient samples using PRADA where the 10% CV level is indicated with a dotted line achieving a LOQ of ~0.03 ng/ml. CV, coefficient variation; LOQ, limit of quantification; PRADA, portable reusable accurate diagnostics with nanostar antennas; SERS, surface enhanced Raman spectroscopy
