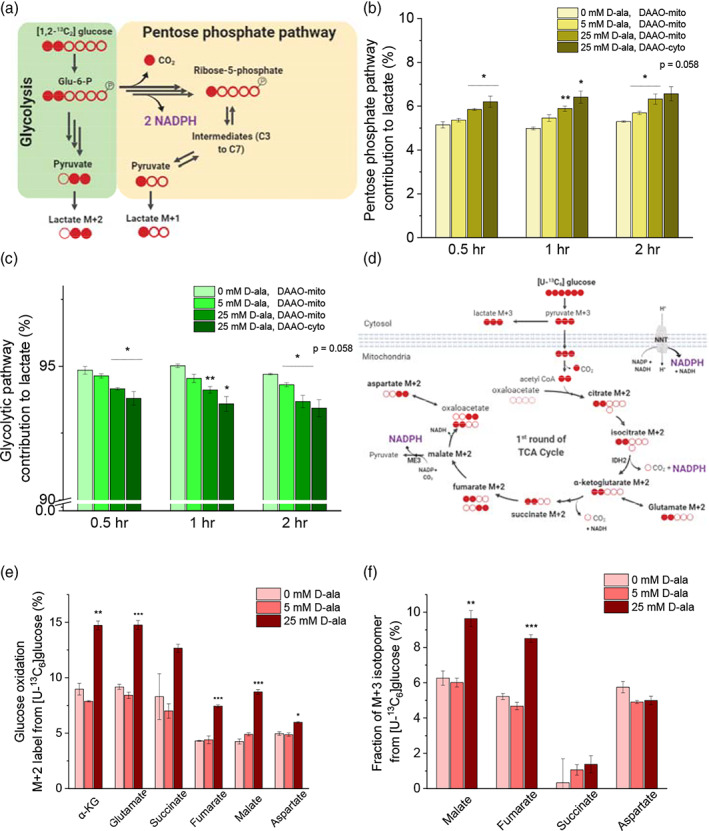
FIGURE 5.

Mitochondrial oxidative stress increases fluxes through pentose phosphate pathway and glucose anaplerosis. (a) Schematic of the labeling pattern from [1, 2 − 13C2]glucose isotope tracer for measurement of a relative pathway strength between glycolysis and the pentose phosphate pathway. (b) Relative strength of pentose phosphate pathway is represented by the fraction of M + 1 of the sum of M + 1 and M + 2 lactate. (c) Glycolytic pathway activity is indicated by the fraction of M + 2 lactate. (d) Carbon transition map demonstrating oxidation of [U − 13C6]glucose tracer and the labeling pattern of TCA metabolites. (e) M + 2 and (f) M + 3 labeling patterns of the TCA metabolites are depicted under different concentrations of D‐alanine addition to Hela cells with mito‐DAAO at t = 2 hr
