
Figure 1.
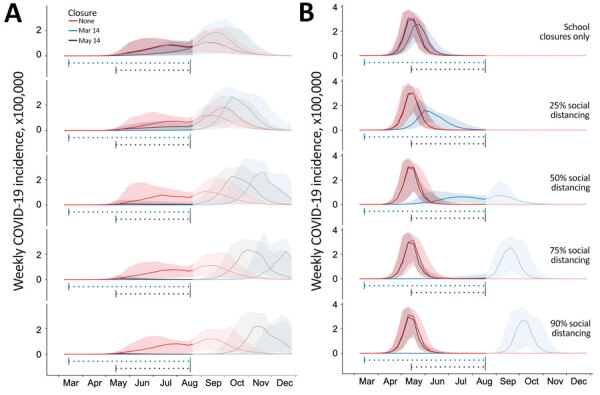
Projected weekly incident of COVID-19 cases in Austin–Round Rock Metropolitan Statistical Area, Texas, USA. Graphs show simulation results for different levels of social distancing and implementation times, assuming an epidemic doubling time of A) 7.2 days (18–20,22) or B) 4 days (22–24). Each graph displays 3 projections: a baseline assuming no social distancing (red), social distancing implemented March 14–Aug 17, 2020 (blue), and social distancing implemented May 14–Aug 17, 2020 (black). From top to bottom, the graphs in each column correspond to increasingly stringent social distancing measures: school closures plus social distancing that reduces nonhousehold contacts by 0%, 25%, 50%, 75%, or 90%. Solid lines indicate medians of 100 stochastic simulations; shading indicates inner 95% ranges of values. The horizontal dotted lines beneath the curves indicate intervention periods. The faded mid-August to December time range indicates long-range uncertainty regarding COVID-19 transmission dynamics and intervention policies. COVID-19, coronavirus disease.