
Figure 2.
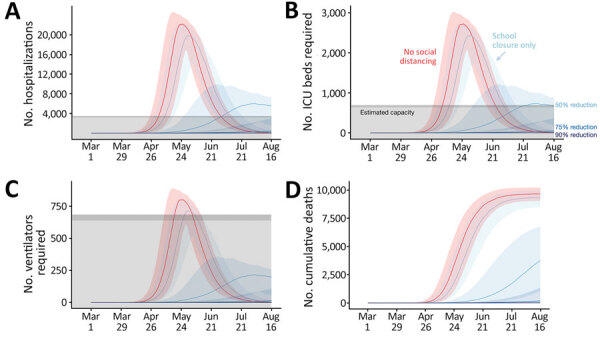
Projected COVID-19 healthcare demand and cumulative deaths in Austin–Round Rock Metropolitan Statistical Area, Texas, USA. Graphs show simulation results across multiple levels of social distancing, assuming a basic reproductive number of 2.2 with a 4-day epidemic doubling time. Extensive social distancing is expected to substantially reduce the burden of COVID-19 A) hospitalizations, B) patients requiring ICU care, C) patients requiring mechanical ventilation, and D) cumulative deaths. Red lines indicate projected COVID-19 transmission assuming no interventions under the parameters given in Table A1. Blue lines indicate increasing levels of social distancing interventions, from light to dark: school closures plus social distancing interventions that reduce nonhousehold contacts by either 0%, 50%, 75%, or 90%. Lines and shading indicate medians and inner 95% ranges of values across 100 stochastic simulations. Gray shaded region indicates estimated surge capacity for COVID-19 patients in the Austin-Round Rock Metropolitan Statistical Area as of March 28, 2020, which is calculated on the basis of 80% of the total 4,299 hospital beds, 90% of the total 755 ICU beds, and 755 mechanical ventilators. COVID-19, coronavirus disease; ICU, intensive care unit.