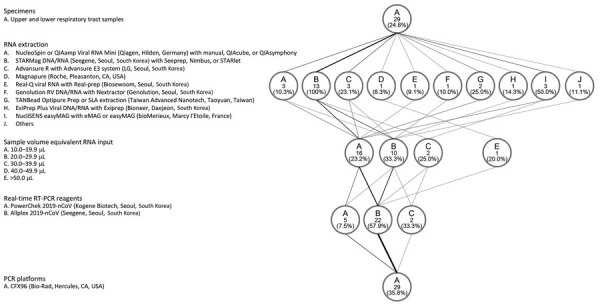
Figure 2.

Protocols used for laboratories that reported >1 outliers in results of real-time RT-PCR tests for severe acute respiratory syndrome coronavirus 2, South Korea, March 23–27, 2020. The flow diagram shows the variations in specimens tested, RNA extraction platforms, PCR reagents and amplification platforms, and sample volume equivalent RNA input used in the PCR reaction. The weight of the lines reflects the number of laboratories using a particular step. Numbers in the circles indicate number of laboratories. RT-PCR, reverse transcription PCR.
