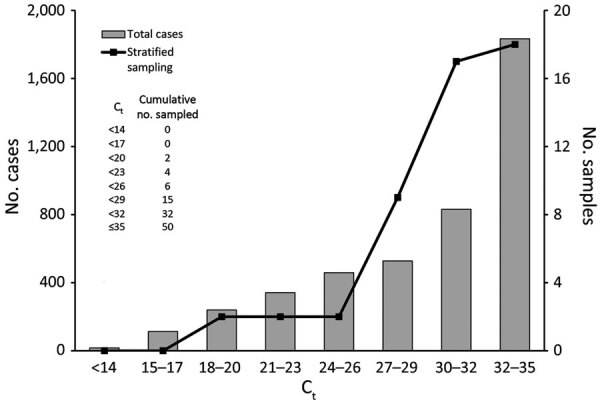
Figure 1.

Distribution of RdRp gene (Ct) values for specimens from 4,364 confirmed patients in South Korea at their initial diagnosis of coronavirus disease (COVID-19) and the specimens selected by stratified sampling. This figure shows the first RdRp gene Ct values of patients receiving a COVID-19 diagnosis (bars). We selected positive samples with the stratified sampling method based on that distribution (line). Cumulative numbers of selected specimens per stratum are shown. Ct, cycle threshold.
