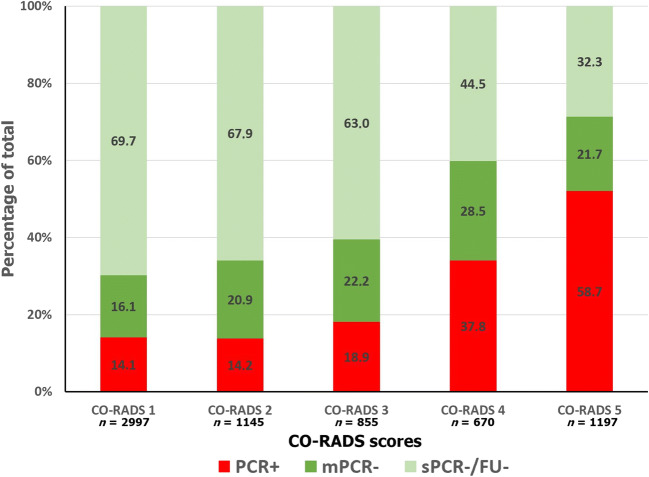
Fig. 3.
Distribution of final diagnosis among each cumulative CO-RADS score category. Red columns show the percentage of patients with positive RT-PCR (PCR+), dark green columns show the percentage of patients with multiple negative RT-PCR (mPCR−), and light green columns show the percentage of patients with initial negative RT-PCR and negative clinical follow-up the 14 days after CT scan (sPCR-/FU-). Note: CO-RADS, COVID-19 Reporting and Data System

