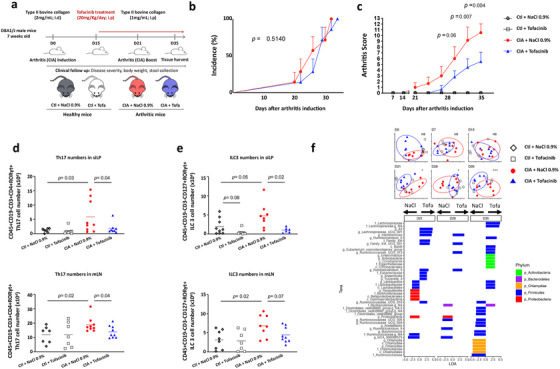
FIGURE 1.

A, Heterologous collagen‐induced arthritis (CIA) was induced in 7 weeks old DBA/1J male mice by an intradermal injection (i.d) of type II bovine collagen (2 mg/mL) emulsified in complete Freund's adjuvant at the base of the tail. At day 21, a booster immunization was performed by an intraperitoneal (i.p) injection of type II collagen (1 mg/mL) in incomplete Freund's adjuvant. Tofacitinib was administered daily (20 mg/kg/day) by i.p injection from arthritis onset (from day 15) until necropsy (day 35). Mice were divided into four groups: (1) vehicle‐treated control; (2) tofactinib‐treated control; (3) vehicle‐treated arthritic, and (4) tofactinib‐treated arthritic mice. Data are compiled from eight mice in each group from three independent experiments. B and C, Disease incidence (B) and disease severity (C) were monitored and scored twice a week from arthritis onset until necropsy. Data are expressed as mean ± SEM for each group. Statistical differences between groups were evaluated using log‐rank test for incidence and using Mann‐Whitney U test for arthritis score. D, Th17 cell number in small intestine Lamina propria (siLP, upper panel) and mesenteric lymph nodes (mLN, lower panel) assessed by flow cytometry after tofacitinib treatment in arthritic mice. Data are expressed as mean ± SD for each group. Statistical differences between groups were evaluated using an ANOVA and Fisher's PLSD post hoc test. E, ILC3 cell number in small intestine Lamina propria (siLP, upper panel) and mesenteric lymph nodes (mLN, lower panel) assessed by flow cytometry after tofacitinib treatment in arthritic mice. Data are expressed as mean ± SD for each group. Statistical differences between groups were evaluated using an ANOVA and Fisher's PLSD post hoc test. F, Tofacitinib effects on microbiota. Upper panel, PCoA plots of Bray‐Curtis divergence for the six times. Significance stars refer to PERMANOVA comparing clustering of arthritic mice treated with placebo (NaCl) or treated with tofacitinib. Control mice are included in the plots for reference. Lower panel: barplots of significantly different taxa by Lefse, comparing arthritic mice given placebo (NaCl) and those given tofacitinib at the three later time points (D21, D28, and D35)
