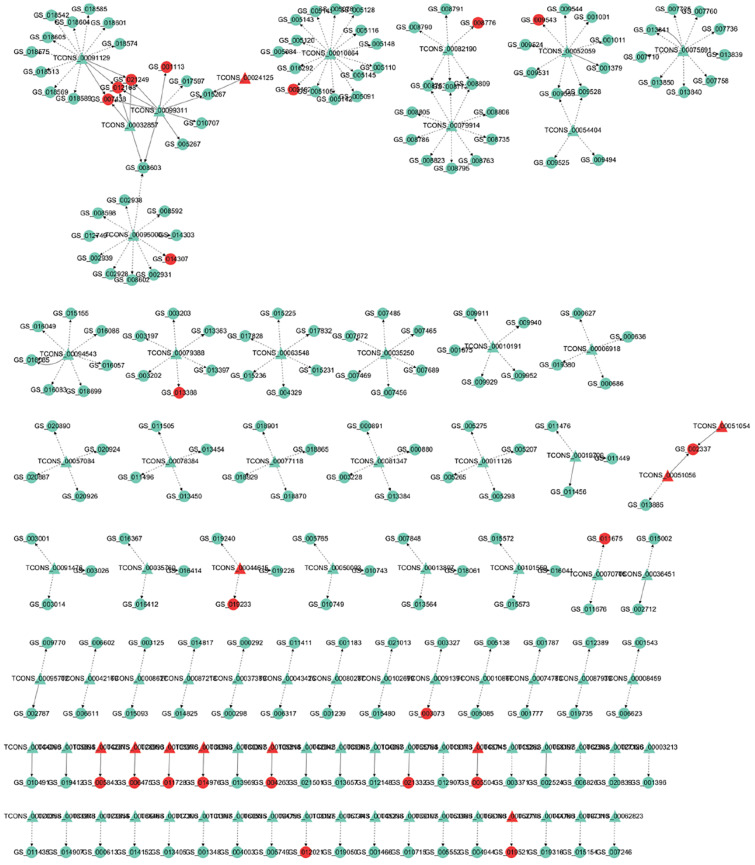
FIGURE 3.
LncRNA – gene interaction network diagram in A vs. B. Red indicates up-regulation, green indicates down-regulation, triangles represent lncRNA, and circles indicate mRNA. The dashed line indicates the interaction between the differentially expressed lncRNA and its corresponding cis target gene, while the solid line indicates the interaction between the differentially expressed lncRNA and its corresponding trans target gene.

