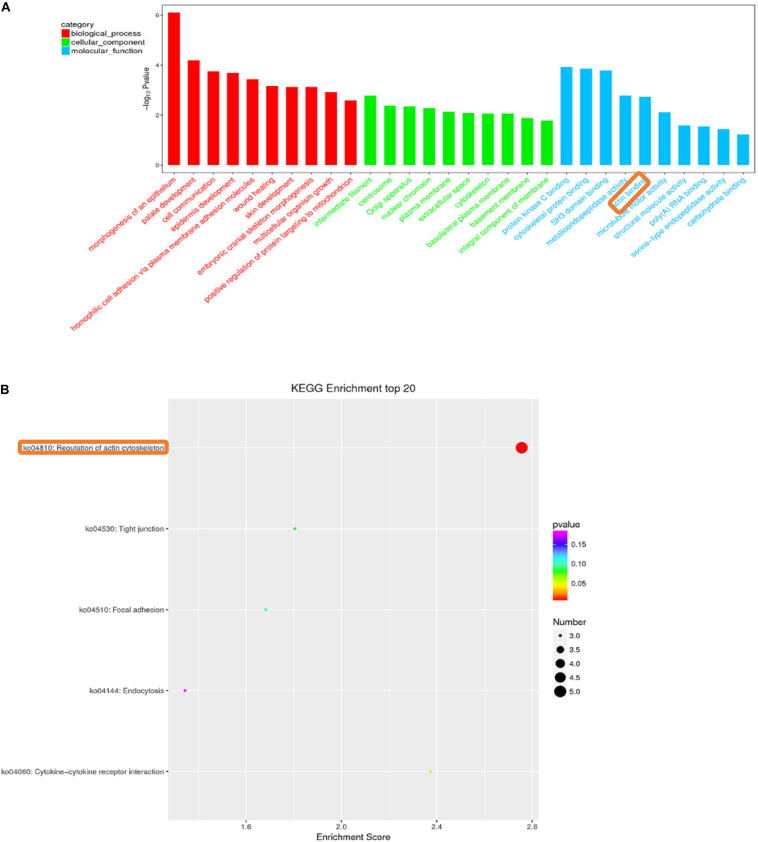
FIGURE 4.
Histogram of gene ontology (GO) classification (A). GO analysis of C vs. D differentially expressed lncRNAs target genes. The horizontal axis indicates the GO entry name and the vertical axis indicates −log10Pvalue. Red bars: biological process; Green bars: cellular component; Blue bars: molecular function. KEGG pathway enrichment of C vs. D differentially expressed lncRNAs target genes (B). The horizontal axis is the enrichment score, the vertical axis indicates the name of the pathway.

