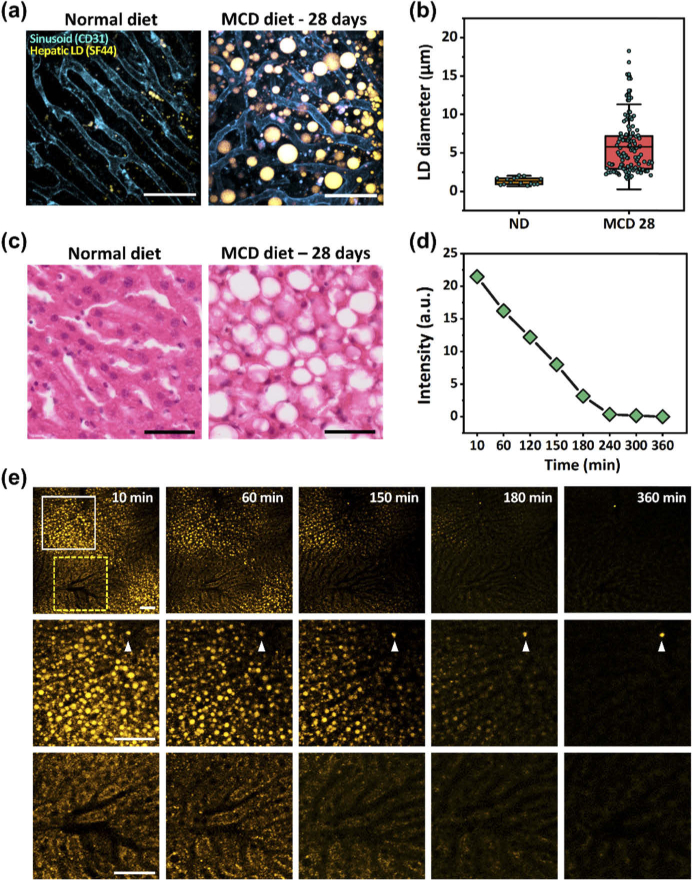
Fig. 2.
Intravital imaging of SF44-labeled hepatic LDs in MCD-diet induced NASH mouse model. (a) In vivo images of hepatic LDs (yellow, SF44) and sinusoid (cyan, CD31) in the liver of mice fed the normal diet or MCD diet for 28 days. Scale bars, 50 µm. (b) Diameter of LD in ND or MCD for 28 days shown on (a). (c) Histopathological hematoxylin and eosin (H&E) staining images of the livers of mice fed the normal diet or MCD diet for 28 days. Scale bars, 50 µm. (d) Graph of temporal changes in the fluorescence intensity of SF44 in the liver of mice fed the MCD diet for 28 days after the intravenous injection of SF44. (e) Wide-area (top row) and magnified (solid-, yellow dotted-line box, respectively) sequential images of the hepatic LDs (yellow) after intravenous injection of SF44 obtained with same excitation laser power and detector sensitivity. Scale bars, 50 µm.

