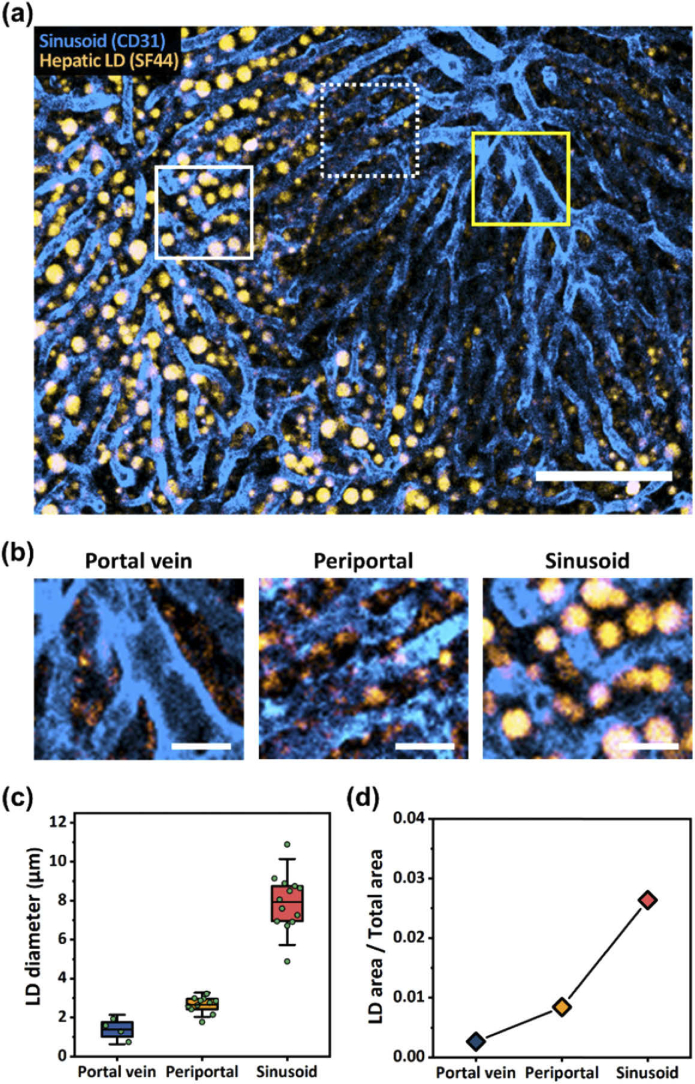
Fig. 3.
Spatial distribution of hepatic lipid droplet in MCD diet-induced NASH mouse model. (a) Wide-area in vivo image showing spatially distributed different-sized hepatic lipid droplets in the liver of mouse fed MCD diet for 14 days. Scale bar, 100 µm. (b) Magnified images of (a) marked by yellow solid-lined box (portal vein), white dotted-lined box (periportal) and white solid-lined box (sinusoid), respectively. Scale bars, 20 µm. (c,d) LD diameter and LD area, respectively at portal vein, periportal, and sinusoid shown on (b).

