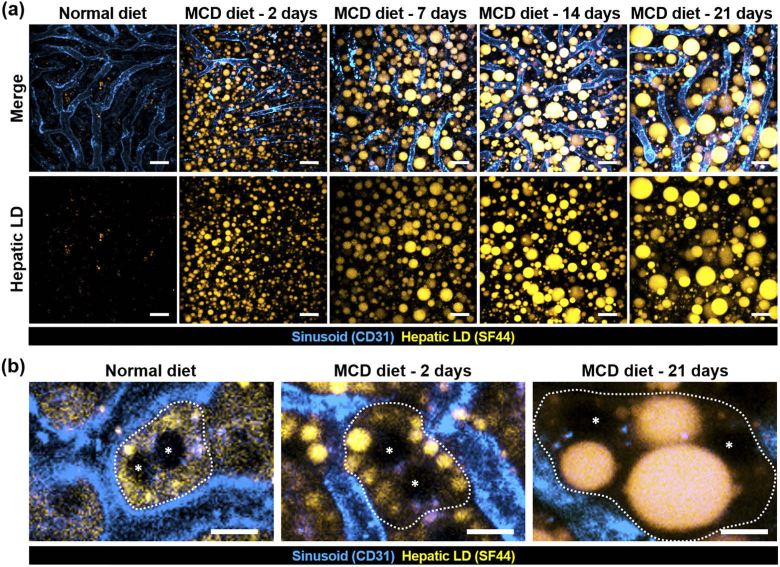
Fig. 4.
Longitudinal intravital imaging of hepatic lipid droplet accumulation in MCD-diet induced NASH mouse model. (a) Representative maximum intensity projection (MIP) images of hepatic LD (yellow, SF44) and sinusoid (cyan, CD31) in the liver of mice fed normal diet or MCD diet. Scale bars, 20 µm. (b) Representative magnified in vivo images of single hepatocyte showing the position of nuclei (asterisks) and boundary (dotted line). Scale bars, 10 µm.

