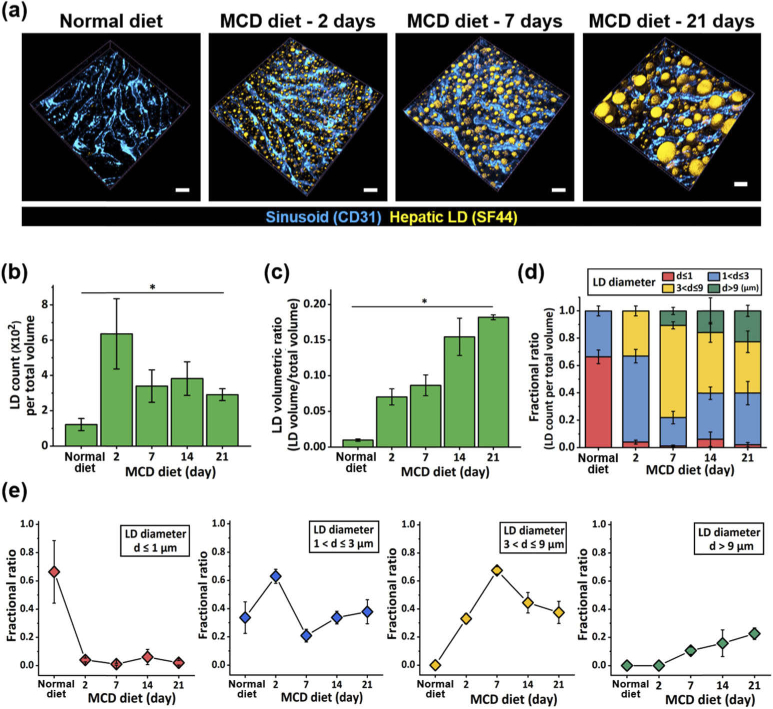
Fig. 5.
Quantitative analysis of longitudinal accumulation of hepatic lipid droplet in MCD-diet induced NASH mouse model. (a) Representative 3D rendered image of hepatic lipid droplets (green, SF44) and sinusoid (red, CD31) in the liver of mice fed normal diet or MCD diet. Scale bars, 20 µm. (b) Number of hepatic lipid droplets. (c) Volumetric ratio of hepatic lipid droplets. (d) Fractional ratio of groups of hepatic lipid droplets with different diameters; d < 1 µm, 1 < d ≤ 3 µm, 3 < d ≤ 9 µm, d > 9 µm. (e) Fractional ratio of hepatic lipid droplet in each group. (d–e) Data are presented as mean ± standard error of mean. 3 mice were analyzed for each group.

