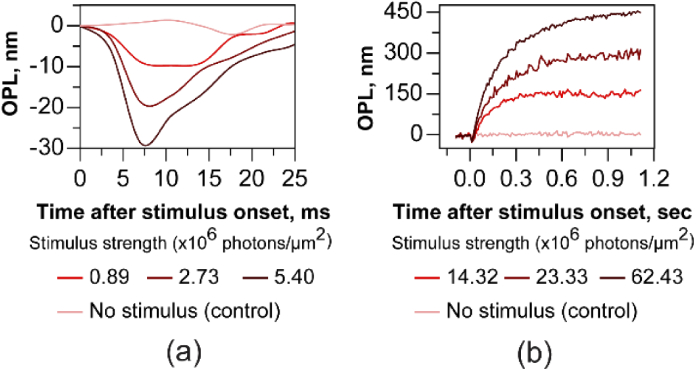
Fig. 8.
Optoretinograms (ORGs) with 660 nm stimulus acquired without adaptive optics. After stimulus onset, cone outer segments undergo a rapid shrinkage in OPL (a) followed by a slower expansion (b). The response magnitude and rate of change scale with increasing stimulus strength. The phase response was averaged over a retinal area of 0.27 deg2. In a), each curve is an average of two separate measurements, while single measurements are shown in b). The early reduction (ORG early response) and later expansion (ORG late response) were measured at 324 Hz and 120 Hz respectively. For the control (no stimulus case), the mean ± standard deviation OPL calculated over ∼1.2 seconds was 2.2 ± 4.9 nm for the single measurement.

