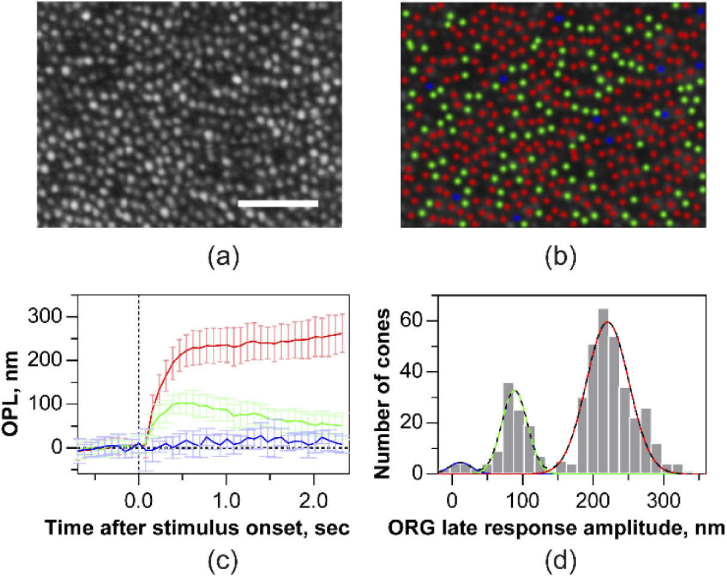
Fig. 9.
Single cone optoretinograms (ORGs) with 660 nm stimulus acquired with AO. (a) Cone photoreceptor image at 4.75 deg temporal eccentricity obtained at the COST layer from a set of registered AO-OCT volumes. (b) Long-, Middle- and Short- (LMS) cones marked as ‘red’, ‘green’ and ‘blue’, classified based on Gaussian mixture model clustering of the ORG magnitude shown in (d). (c) The mean and standard deviation of the ORG in individual L-, M- and S-cones. Solid lines and error bars denote the mean and ± 1 std across the population of cones. (d) A histogram showing the distribution of ORG magnitude. The black dashed line denotes the sum of three Gaussians obtained from the clustering analysis. The individual component Gaussians are shaded red, green, blue, denoting the LMS-cones respectively. Volume rate was 15 Hz. Scale bar: 50 µm.

