Fig. 5.
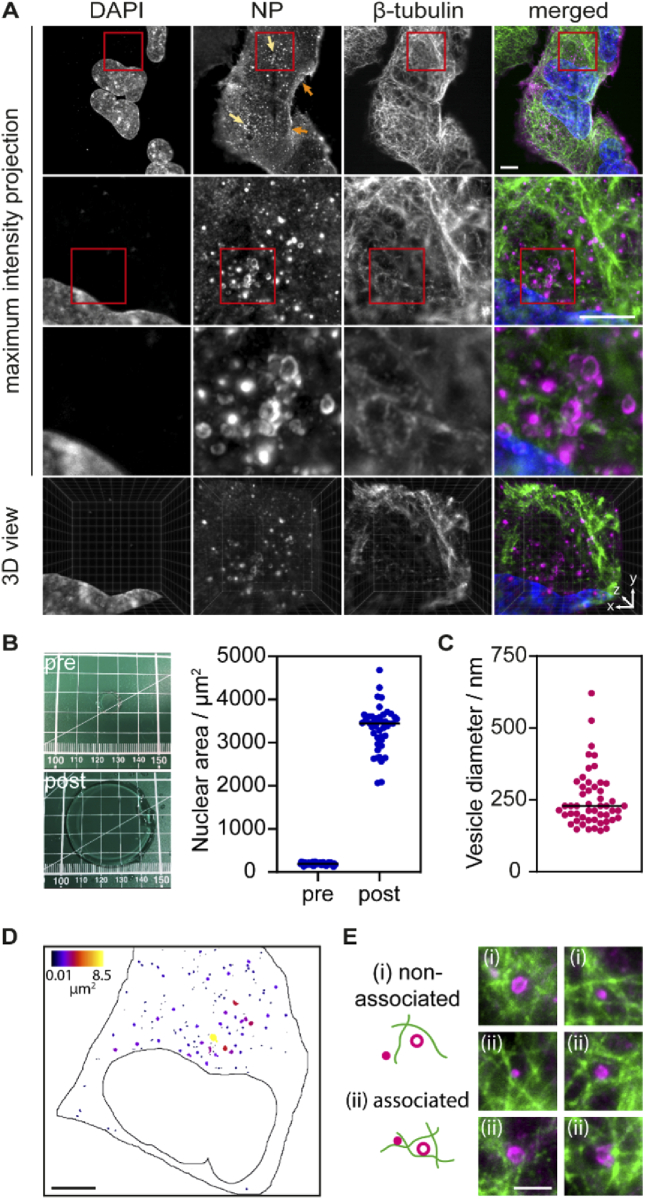
(A) Maximum intensity projections of expanded A549 cells infected with live attenuated influenza vaccine (LAIV). The expansion allows resolving the structure of the viral nucleoprotein NP, which forms vesicular structures in the cytosol before the virus egress. Cells were fixed 9 hours post infection, immunostained, expanded and imaged using a light sheet microscope. Cell nuclei are shown in blue, LAIV nucleoprotein (NP) in magenta and microtubules in green. Scale bar 20 µm. Images in the third row are 20 × 20 µm2. Fourth row shows a snapshot by the ClearVolume plugin for ImageJ [39]. Arrows in the first row NP image indicate small vesicles at the cell periphery (orange) and big vesicles at the perinuclear region (bright yellow). (B) A linear expansion factor of 4.2 (corresponding to a volumetric expansion factor of 74) was calculated by measuring the gel size before and after expansion (left panel), as well as by measuring the area of 50 cell nuclei before and after expansion (right panel). (C) The expansion factor was used to calculate the size of the NP-containing vesicles. (D) Spatial distribution of NP vesicles colour-coded for their size. A mask was created from the maximum intensity projection of the fluorescence image through intensity thresholding and colour-coded using the BioVoxxel Toolbox for ImageJ. Scale bar 20 µm. (E) Representative examples of NP vesicles located within the microtubule network. Shown are two-colour maximum intensity projections over a z distance of 3 µm. We find NP vesicles non-associated (i) and associated (ii) with microtubules. Scale bar 5 µm.

