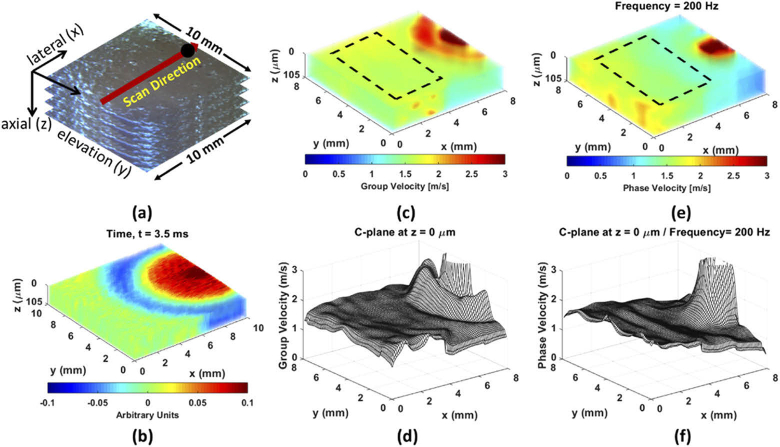
Fig. 10.
(a) The camera image of the renal cortex with 5 mm thickness. The black solid dot is the ARF excitation spot. (b) 4D-OCT dynamic wave propagation. (c) The reconstruction of 3D-OCE group velocity. (d) The 3D-OCE group velocity on the first C-plane, indicated by the ROI with the black dash lines in (c). (e) The reconstruction of 4D-OCE phase velocity at = 200 Hz. (f) The 4D-OCE phase velocity on the first C-plane of at = 200 Hz, indicated by the ROI with the black dash lines in (e).

