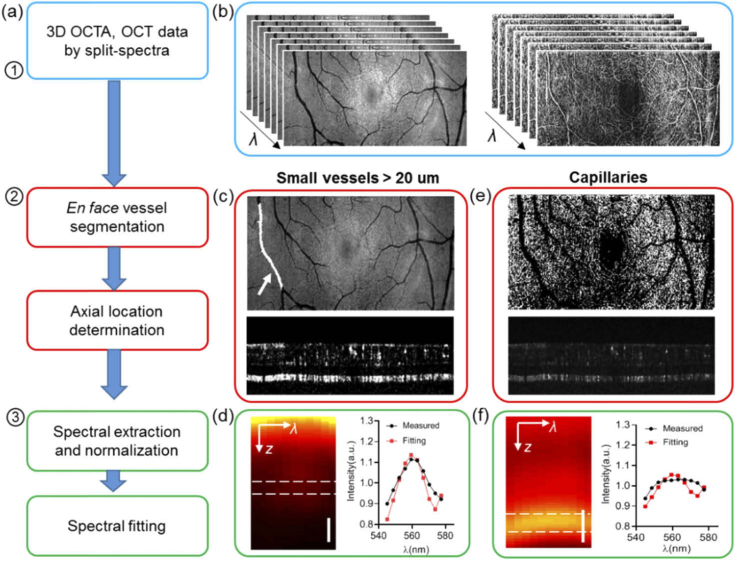
Fig. 2.
Data processing flow for small vessel and capillary sO2 calculation. (a) Flow chart of the data processing. (b) Wavelength-dependent vis-OCT and vis-OCTA generated by a split spectra method. (c) Illustration of the vessel segmentation on the lateral projection image from vis-OCT, and vessel bottom selection on vis-OCTA for small vessels > 20 µm. (d) An example of the averaged spectrograph in terms of depth within a vessel, and the spectrum extracted from the vessel bottom for the spectral fitting (red). (e) Illustration of capillary segmentation from en face vis-OCTA projection and the depth locations. (f) An example of a spectrogram on capillaries, and the spectrum extracted from the spectral fitting.

