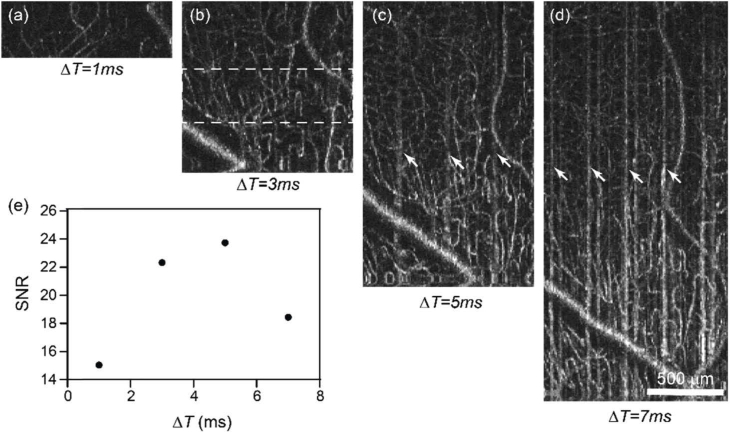
Fig. 4.
The effect of the B-scan interval time on human retina vis-OCTA. (a-d) En face maximum intensity projection of vis-OCTA in the inner retina at the interval time ΔT equal to 1-7 ms between two consecutive frames at each B-scan location, while the A-scan density were maintained constant. White arrows points to motion artefacts. (e) Capillary vis-OCTA SNR versus ΔT.

