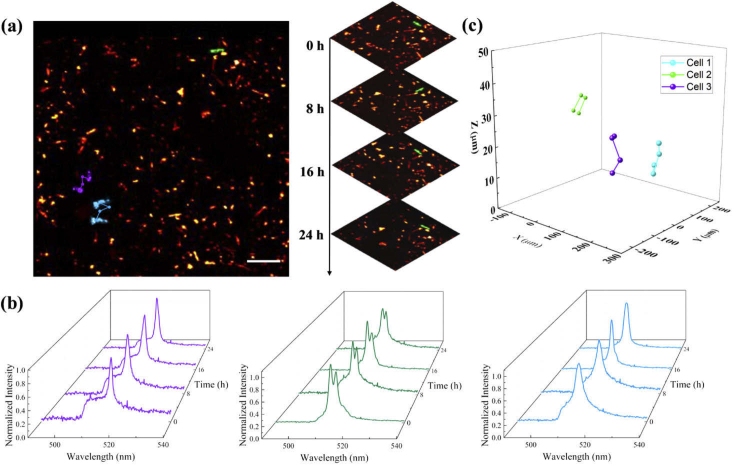
Fig. 4.
In vitro cell migration tracking. (a) The corresponding fluorescence 2D macrophage migration trajectory. The tracked macrophages are accordingly highlighted with purple, green, and blue. The right inset is a demonstration of macrophage migration over time through multiple frames. (b) The normalized lasing spectra collected for macrophage migration tracking over time. The purple, green, and blue waterfall spectra are corresponding to the same color-labeled macrophages in (a) and (b) respectively. (c) The in vitro 3D macrophage migration trajectory extracted from multiple OCT scans over 24 hours. The tracked macrophages are highlighted with purple green and blue. Scale bar: 100 µm.

