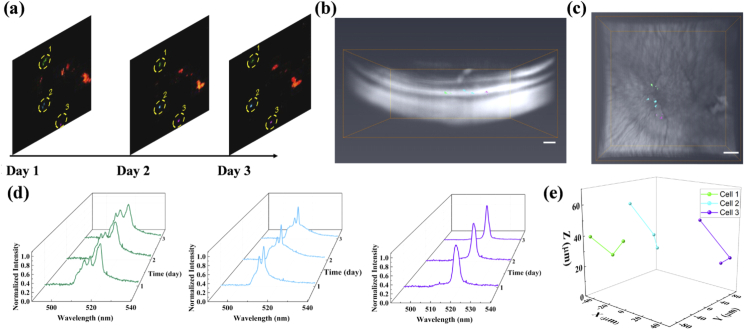
Fig. 6.
In vivo cell migration tracking. (a) In vivo fluorescence images of macrophage migration projections through multiple observations. Three of the tracked macrophages are highlighted with green, blue, and purple. (b)-(c) Side and top views of 3D OCT retinal layer reconstruction and the spatial locations of macrophages. The spatial locations of the same nanowire-labeled macrophages in (a) over 3 days are extracted by thresholding segmentation and superimposed with the retinal structure. The three macrophages are shown with the corresponding colors in (a). (d) Normalized lasing spectra collected for macrophage migration tracking over time. The green, blue, and purple waterfall spectra are corresponding to the same color-labeled macrophages in (a), (b), and (c). (e) The in vivo 3D macrophage migration trajectory extracted from multiple OCT scans over 3 days. The tracked macrophages are highlighted with green, blue, and purple accordingly. Scale bar: 100 µm.

