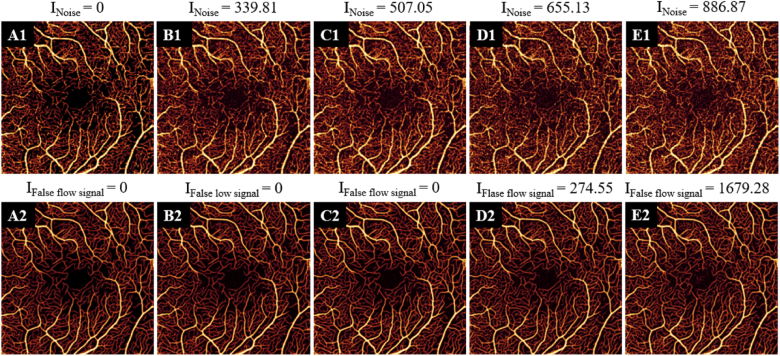
Fig. 6.
3×3-mm superficial vascular complex (SVC) angiograms with different noise intensities. (A1) In 3×3-mm angiograms denoised with Gabor and median filtering, the noise intensity is 0. (B1-E1) 3×3-mm SVC angiograms with different noise intensities. (A2-E2) 3×3-mm angiograms reconstructed from the corresponding angiograms in row 1. When the noise intensity is less than 500, there is no false flow signal.

