Abstract
Hyperspectral fluorescence lifetime imaging allows for the simultaneous acquisition of spectrally resolved temporal fluorescence emission decays. In turn, the acquired rich multidimensional data set enables simultaneous imaging of multiple fluorescent species for a comprehensive molecular assessment of biotissues. However, to enable quantitative imaging, inherent spectral overlap between the considered fluorescent probes and potential bleed-through must be considered. Such a task is performed via either spectral or lifetime unmixing, typically independently. Herein, we present “UNMIX-ME” (unmix multiple emissions), a deep learning-based fluorescence unmixing routine, capable of quantitative fluorophore unmixing by simultaneously using both spectral and temporal signatures. UNMIX-ME was trained and validated using an in silico framework replicating the data acquisition process of a compressive hyperspectral fluorescent lifetime imaging platform (HMFLI). It was benchmarked against a conventional LSQ method for tri and quadri-exponential simulated samples. Last, UNMIX-ME’s potential was assessed for NIR FRET in vitro and in vivo preclinical applications.
1. Introduction
Fluorescence imaging is the most employed molecular imaging technique from the wet lab to the bedside. A key strength of fluorescence imaging is its ability to simultaneously image multiple fluorophores (multiplexing) to interrogate the sample’s molecular features. Typically, multiplexing is achieved via selection of exogenous fluorophores with distinct spectral features. Though, spectral overlap of the fluorophore’s emission is unavoidable, leading to bleed-through between acquisition channels. This is also an outstanding challenge in endogenous imaging, in which multiple species can be simultaneously excited at a given wavelength. Hence, spectral imaging is always associated with spectral unmixing algorithms that leverage the spectral signature of each individual fluorophore to determine their individual contributions at each pixel from the raw fluorescence images. Such unmixing methodologies are often based on a priori fitting techniques that use publicly available or experimentally acquired “pure” spectra [1]. However, spectral imaging and linear unmixing are sensitive to noise, large spectral overlap and/or wrong or incomplete spectral information [2]. Besides fluorescence intensity, it is also possible with dedicated instruments to quantify fluorescence lifetime, which is an intrinsic characteristic of fluorophores. However, for biomedical applications, it is challenging to perform unmixing beyond two lifetime contributions due to the low level of lights typically encountered. Recently, there has been great interest in performing multi- or hyper-spectral Fluorescence Lifetime Imaging (FLI) to augment the potential of lifetime imaging for highly multiplexed studies [3–5]. Especially, coupling spectral unmixing with FLI has the potential to achieve significantly higher unmixing sensitivity and specificity than that of intensity-based or lifetime-based methods alone [6]. Despite great progress in instrumentation that helps collect such multidimensional data sets, the approach to perform unmixing is still typically applied along spectra or time, not both dimensions together. Herein, we propose “UNMIX-ME” (unmix multiple emissions), a deep convolutional neural network (CNN) -based framework that performs fluorophore unmixing by leveraging both spectral and lifetime contrast concomitantly.
UNMIX-ME is designed to retrieve the spatially resolved abundance coefficients associated with the sample’s fluorophores from the spectrally resolved fluorescence decay measurements. The proposed methodology is developed within the context of Hyperspectral Macroscopic Fluorescence Lifetime Imaging (HMFLI). Such approach is based on a recently proposed novel instrumental concept that leverages a single-pixel strategy to concurrently acquire 16 spectrally resolved FLI channels over large field of views (FOV) [3]. Through the use of Deep Learning (DL), HMFLI has proven capable of probing nanoscale biomolecular interactions across large fields of view (FOV) at resolutions as high as 128×128 within minutes [7]. DL has also greatly improved the processing time for its inverse solving procedure, yielding intensity and lifetime reconstructions in a single framework, through usage of simulated training data mimicking the single-pixel data generation [8]. UNMIX-ME aims to further enhance the HMFLI hyperspectral toolbox by facilitating accurate unmixing capabilities. First, we report on the design of UNMIX-ME architecture. Then we describe the novel data simulation routine developed to efficiently generate 16-channel fluorescence temporal point-spread functions (TPSFs) used to train our CNN. This allows to bypass the need of collecting large quantities of experimental data and enables the enforcement of correct parametric mapping to ground truth instead of relying on fitting procedures. The performances of UNMIX-ME are reported for both the case of tri and quadri-component unmixing in silico. To further validate UNMIX-ME, we report on its capability to process in vitro HMFLI data sets of Föster Resonance Energy Transfer (FRET) with excitation and emission spectra in the near-infrared (NIR) – i.e. fluorophores currently known to possess short lifetime values (sub-nanosecond) and correspondingly high analytic complexity. Lastly, we present hyperspectral lifetime unmixing results for two in vivo datasets as acquired in [7]: 1) Trastuzumab (TZM) AF700/AF750-conjugated FRET pair, for an athymic nude mouse bearing a tumor xenograft and imaged 76 hours post-injection and 2) Transferrin (Tf) AF700/AF750-conjugated FRET pair to compare Tf uptake in mouse liver and bladder.
2. Methods and results
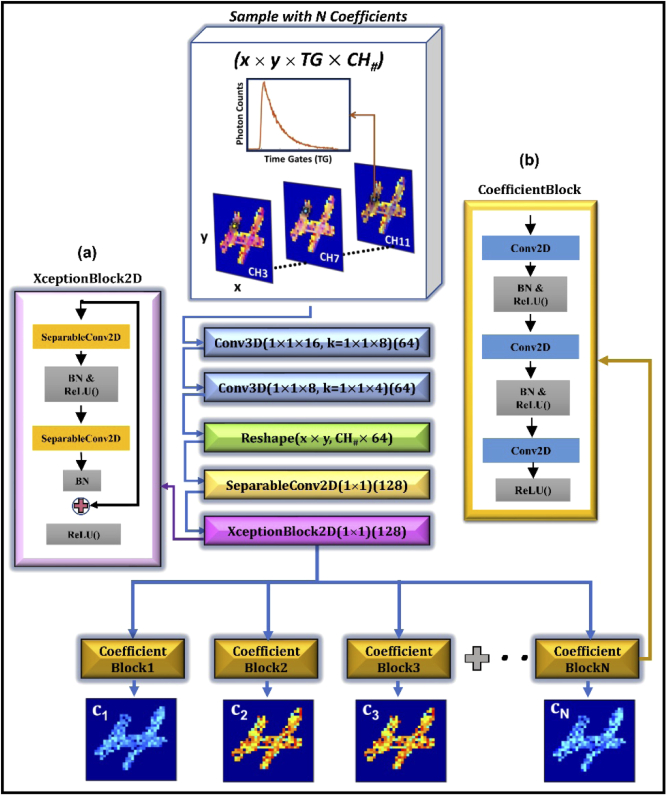
UNMIX-ME’s CNN architecture (Fig. 1) was crafted such that extraction of temporal information was prioritized while mitigating the computational burden associated with processing simultaneously 16 spectral channels-worth of TPSF data. Given that the use of 3D convolutional operations (Conv3D) is notoriously expensive computationally, just two Conv3D layers employing large stride were included – allowing for significant reduction in parametric size within the early layers. The output from these layers was transformed into 2D and followed by 2D separable convolutions [9] with kernel size 1×1 as a more computationally friendly alternative for spatially-independent temporal and spectral feature extraction. Moreover, “XceptionBlock” [10] operations (i.e., residual blocks with 1×1 separable convolutions) were included to ensure that our model would reap the benefits obtained through residual learning [11] while maintaining focus on the primary objective – spatially-independent temporal and spectral feature extraction. UNMIX-ME introduces the concept of “CoefficientBlocks”, individual branches composed of a set of 2D convolutions intercepted by batch normalization and activation layers, with each branch meant to focus on features relevant for fluorophore-specific abundance coefficient retrieval. These blocks facilitate seamless architecture modification for retrieval of N number of targeted fluorophores.
Fig. 1.
UNMIX-ME model architecture. HMFLI input mapped to spatially independent unmixed fluorescence coefficient values (a) “XceptionBlock” [10] comprised of 1×1 separable convolutions [9]. (b) “CoefficientBlock” structure.
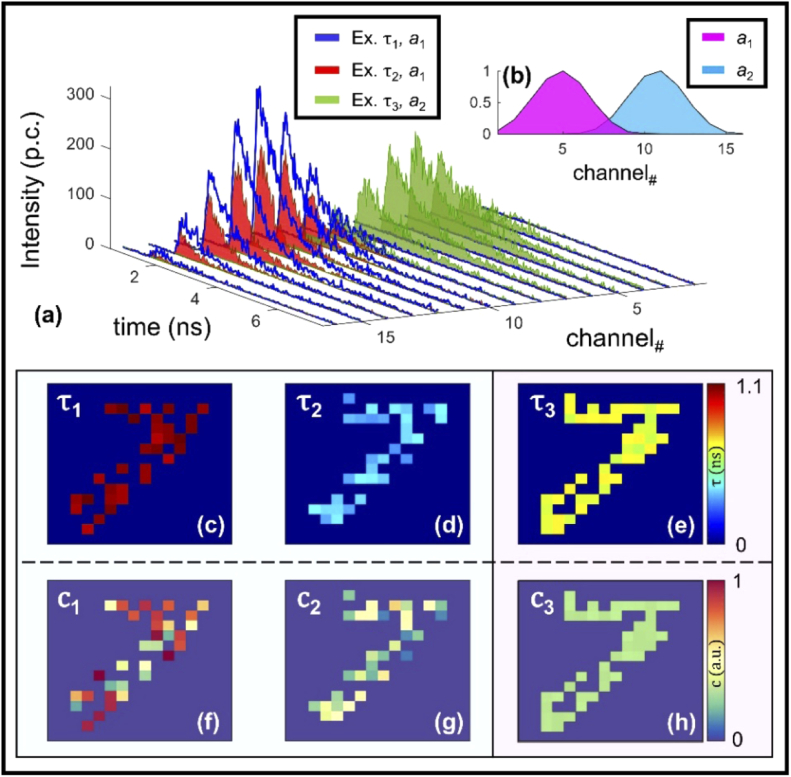
As Fig. 2 illustrates, the data generation workflow for efficient but comprehensive training employed in this work partially follows the scheme of our previous work [8,12]. In brief, a binary handwritten number dataset EMNIST was used for assignment of spatially-independent random variables of TPSF (Γ(t)) as provided in Eq. (1). These variables include the lifetime values of fluorescent species involved (), associated relative abundance coefficients () and intensity scalar (I, expressed in photon counts). Note that these abundance coefficients are the output retrieval of UNMIX-ME (i.e. , and in the case of a tri-exponential application, Eq. (2)) [1]). Additionally, the instrument response function, , is considered in the simulations to replicate as closely as possible experimental settings (example for three molecular species):
| (1) |
| (2) |
where corresponds to the instrument response function, the relative spectral brightness of the nth fluorophore at the wavelength λ, and I to the overall photon counts to be detected. All variables used during spatially-independent generation of TPSFs were assigned at random value over wide bounds (ex., Fig. 2: (, , , I) ∈ [0.9-1.1 ns, 0.3-0.4 ns, 0.55-0.65 ns, 50-500 p.c.]). These bounds represent typical values in NIR fluorescence imaging. It is trivial to extend these expressions to include for both the CNN and the simulation workflow.
Fig. 2.
Data simulation workflow. A binary MNIST image is assigned lifetime values within three bounds (c-e). Using these values, along with spatially unique spectra (average given in b) for gathering intensity multipliers, 16 TPSFs are created at each non-zero spatial pixel (a). The coefficients are calculated shortly after (f-h).
Figure 2(a) illustrates an example case of tri-specie unmixing in the challenging case of two fluorophores possessing the same emission spectral profile – a phenomenon inherent to both endogenous and FRET imaging. Indeed, FRET phenomena, which is the main experimental focus of this work, occurs when a fluorophore pair, referred to as the donor and acceptor fluorophores (corresponding to lower and higher wavelength, respectively), satisfy two conditions: 1) the emission spectra of the donor specie overlaps with that of the excitation spectra of the acceptor, 2) both fluorophores are oriented in a particular fashion relative to each other and are in close proximity (within < 10 nm) [13]. Accurate retrieval of abundance coefficients from fluorescent species possessing similar emission profiles necessitates either complex and heavily restrictive imaging protocols or time-consuming analytic pipelines based around iterative fitting. To ensure UNMIX-ME was sensitive to spectral bleedthrough, each spatial location which did not possess all three species was made to map all non-present coefficient values to zero. Greater detail regarding the simulation workflow is contained in the Appendix: Section 1 and GitHub repository [14]. Thus, each simulated 4D dataset was of size 16×16×256×16 (x, y, time-points, wavelength channels). The presented network model was built using Tensorflow with Keras backend in python. Training was performed over approximately 100 epochs using a total number of 2,500 datasets (80%-20% training-validation) and mean-squared error (MSE) loss. The total time for data simulation and training was 40 minutes and 15 minutes, respectively (NVIDIA Titan GPU). Further details of the training curves per number of species and t-distributed Stochastic Neighbor Embedding (t-SNE) visualizations of the different training coefficient ranges across the network are explained in Appendix: Section 3.
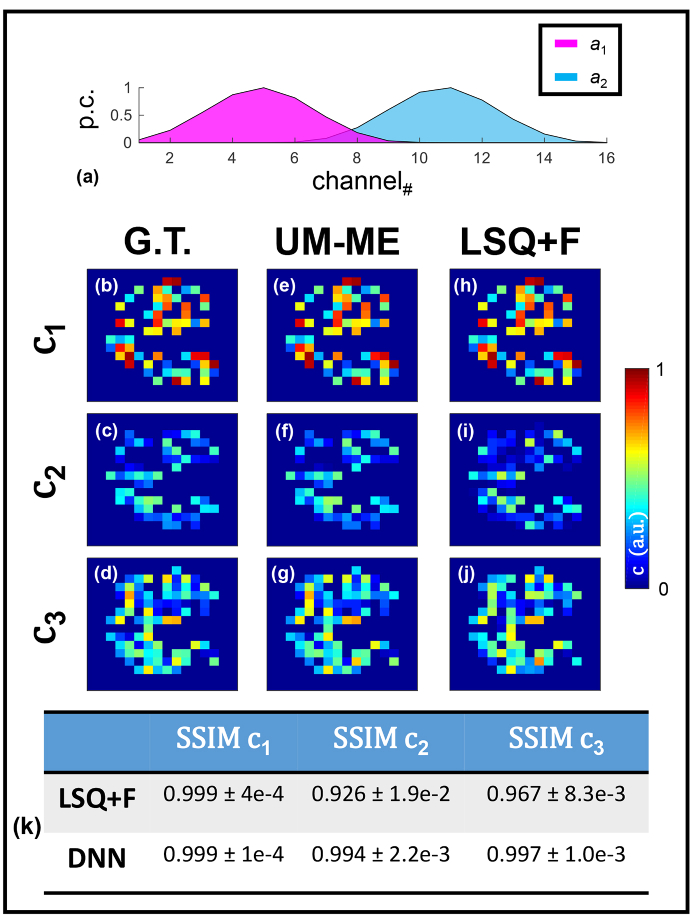
First, 250 tri-specie (two spectra, three lifetime) spectral TPSF data were simulated to illustrate how both our DNN and non-linear spectral unmixing coupled with least-squared bi-exponential lifetime fitting (LSQ + F) perform versus ground-truth during tri-spectral unmixing in silico (Fig. 3). Two overlapping gaussian profiles (Fig. 3(a)) were used to mimic independent
Fig. 3.
Three-coefficient spectral unmixing in silico. Averaged spectra used for simulation (a) are given. (b-d) Ground-truth values are illustrated as well as the coefficients retrieved via DNN lifetime unmixing (e-g) and conventional LSQ + F fitting (h-j). Table 1 provides average and standard deviation MSE values calculated across 100 test samples as for additional performance quantification.
Table 1. Mean-squared error calculated for all three coefficient values through both techniques (complement to Fig. 3).
| Technique | MSE | MSE | MSE |
|---|---|---|---|
| LSQ + F | 4.2e-5 ± 9.0e-6 | 3.7e-3 ± 1.1e-3 | 3.9e-3 ± 1.1e-3 |
| UNMIX-ME | 2.3e-5 ± 7.6e-6 | 3.1e-4 ± 1.1e-4 | 3.2e-4 ± 1.0e-4 |
16- channel emission spectra. Further, lifetime parameters were assigned at random between three set bounds: (, , ) ∈ [0.95-1.1, 0.3-0.45, 0.55-0.7] ns. 2,500 separate data were generated for model training. Figure 3(e-g) illustrates high spatial concordance with regards to all three coefficients, which is confirmed by the high SSIM values listed in Fig. 3(k). Though high SSIM values are observed through LSQ + F retrieval of , a dip in accuracy is noted for both remaining coefficients. This dip in accuracy is not surprising given that and possess the same emission profile and depended upon often error-prone, iterative lifetime fitting to correct the coefficient value obtained through spectral decomposition.
For experimental validation, values were obtained from the HMFLI time domain reconstruction of a NIR-FRET well-plate with varying volumetric fractions of Transferrin (Tf) conjugated AF700 and AF750 dye, as illustrated in Fig. 4. The 4D input dataset was of size 64×64×256×16. The time domain reconstruction process is further explained in Appendix: Section 2. Förster Resonance Energy Transfer (FRET) unmixing is a uniquely complex two-spectra three-specie problem given the under and overestimation of the donor and acceptor fluorescent contribution due to quenching, respectively [15,16]. Though, this effect was easily taken into account during data simulation (detailed in Appendix: Section 1) [16].
Fig. 4.
HMFLI-FRET in vitro. Results from non-linear iterative spectral decomposition combined with lifetime fitting (LSQ + F) (a-j) and UNMIX-ME (k-t) are given. Boxplots of coefficient values retrieved at each ROI (labeled by acceptor/donor ratio) are given per reconstruction. Accepter/donor ratios are labeled per well in (a).
The UNMIX-ME framework allowed for retrieval of total Tf-AF700 and Tf-AF750 coefficient values adhering much more closely to the expected values Fig. 4(p-t) compared to conventional LSQ + F, Fig. 4(f-j). All wells containing Tf-AF700 (referred to herein as total , or ) were prepared with constant volume and thus the decreasing trend observed through LSQ + F (Fig. 4(h)) is much higher than that illustrated through UNMIX-ME (Fig. 4(r)). Further, the second and third row were both prepared with same increasing volumes of AF750 (), and thus the trend observed should be identical. Figure 4(i) illustrates an overestimation of Tf-AF750 in the second row via LSQ + F – an expected result given the overestimation of acceptor concentration in the case of FRET. In contrast to this, UNMIX-ME provides quantification with significantly higher overlap (Fig. 4(s)). Moreover, though FRET quantification (FD (%), i.e., FRET donor fraction) through both UNMIX-ME (Fig. 4(t)) and LSQ + F (Fig. 4(j)) were relatively similar for the 1:1 to 3:1 cases, the single-specie well (0:1) was overestimated through iterative fitting while UNMIX-ME correctly estimated values of zero across the entire well. The quenched donor () abundance estimated through UNMIX-ME (Fig. 4(q)) provides both a much more easily distinguishable increasing trend from well-to-well (as expected) and correctly assigned values of zero at the 0:1 ROI than when using LSQ + F (Fig. 4(g)).
Finally, UNMIX-ME was used for two complex cases of HMFLI-FRET imaging in vivo. MFLI allows to quantitatively report on target-receptor interaction via in vivo lifetime-based FRET and further FD (%) quantification [17,18]. First, HMFLI data acquired from a nude athymic mouse 6-hours post-injection with Tf-conjugated AF700 and AF750 FRET pair (in a 2:1, acceptor-to-donor ratio) was unmixed via both methods for comparison. The engagement of Transferrin (Tf) receptors in the liver results in a change in lifetime and FD (%) compared to excretion organs like the bladder, therefore allowing for further organ classification [19]. For this task and as previously shown for in vitro samples the FD (%) will be resolved for both methods from the resulting unmixed abundance coefficients of the unquenched and quenched donor ( and respectively). Ideally, (/) ratios closely correspond with the 2:1 injected acceptor to donor concentration. Furthermore, the resolved coefficients should reflect the difference in lifetime and FRET between liver and bladder organs. For brevity, the results of this experiment are illustrated and discussed in Appendix: Section 4. UNMIX-ME exhibited the capability to better resolve the change in lifetime and FD (%) upon the retrieved donor () and acceptor () coefficients compared to LSQ(+F). UNMIX-ME better depicted the expected quenching of the donor in the liver which contains a high volume of Tf receptors but not in the bladder. At the same time, the injected 2 () to 1 () acceptor to donor concentration was better described by UNMIX-ME’s unmixed relative abundance coefficients.
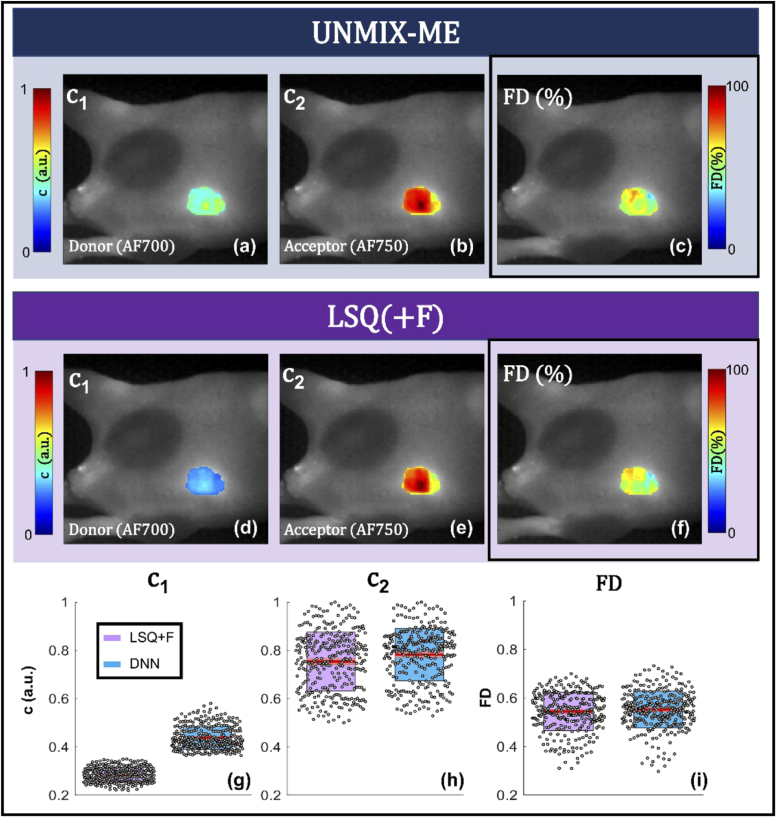
The second and final in vivo case, results of which are displayed in Fig. 5/6, involves 76-hours post-injection data acquired from a nude athymic mouse bearing a tumor xenograft and injected with HER2 targeted-Trastuzumab AF700 and AF750 FRET pair (in a 2:1, acceptor-to-donor ratio). TZM is used to treat metastatic breast cancer in the clinic and has been recently proposed for fluorescence lifetime imaging [20]. Engagement to HER2 receptors present in the tumor region will result in a decrease in lifetime and increase in FRET interaction (FD (%)). These expected changes should be also reflected in the unmixed acceptor, quenched/non-quenched donor coefficients retrieved. As for the previous FRET in vivo experiment, the FD (%) will be retrieved via both LSQ(+F) and UNMIX-ME. HMFLI data was reconstructed for a 128×128 resolution and acquired over 6 minutes for 16 detection wavelengths (channels) through high data compression as highlighted elsewhere [7]. The tri-component (unquenched donor + quenched donor () and acceptor () spectral lifetime unmixing was retrieved using both LSQ + F Fig. 5(d-f) and UNMIX-ME in Fig. 5(a-c). Quantification for these regions are displayed in Fig. 5(g-i). In vivo spectral unmixing results illustrated in Fig. 5 were obtained through photon-count thresholding to focus solely on the xenograft region. The FRET- FD (%) quantification obtained through both methods is in high concordance – a result previously observed at higher FRET levels in vitro (Fig. 4(j, t)). However, the comparison of results of acceptor in Fig. 5(h) to donor in Fig. 5(g) illustrate that / ratios (results calculated the by division of reconstructed by that of followed by retrieving the average and standard-deviation of all pixels within the xenograft ROI – Fig. 6) obtained through UNMIX-ME correspond much more closely with the 2:1 injected acceptor to donor concentration than those obtained through LSQ + F.
Fig. 5.
HMFLI-FRET imaging of tumor xenograft in vivo. Mouse xenograft imaged at 76-hours post-injection of Trastuzumab (mix of AF700 & AF750 conjugates with A:D 2:1). Results from UNMIX-ME (a-c) and LSQ + F (d-f). Boxplots are given for further quantitative clarity (g-i).
Fig. 6.
Additional information provided to complement the in vivo spectral lifetime quantification performed in Fig. 5. Histogram provides all acceptor/donor ratios obtained for each spatial location across the tumor ROI. The table provides averaged and standard deviation values for both coefficients and the FRET % values obtained through both methods.
3. Conclusions
In summary, we present UNMIX-ME, a DNN-based workflow trained with simulation data for fluorescence lifetime unmixing. Furthermore, unlike intensity-based approaches paired with iterative lifetime fitting, UNMIX-ME simultaneously leverages intensity and lifetime features for sensitive retrieval of relative abundance coefficients of the mixed fluorophores. UNMIX-ME provided improvement over a conventional sequential iterative fitting methodology by demonstrating higher concordance with ground truth during tri- and quadri-abundance coefficient retrieval (Figs. 7–9). Furthermore, UNMIX-ME provided accurate unmixed profiles for complex HMFLI data from FRET interactions in vitro and for two independent non-invasive HMFLI in vivo experiments, where the retrieved abundance donor and acceptor coefficients were used to calculate FD (%) and further validate the injected 2:1 acceptor to donor concentration ratio of the dyes. Through the calculated FD (%) UNMIX-ME effectively accomplished organ classification for Transferrin based targeting of liver and bladder (Fig. 10) and tumor xenograft targeting of HER2 receptors in tumor xenograft through Trastuzumab. Thus, UNMIX-ME unlocks the possibility for efficient and accurate fluorescence lifetime unmixing of multiplexed data at the macroscopic level. Though our results presented were retrieved via use of the HMFLI apparatus (depicted in Fig. 11), this approach lays the groundwork for the future application of DNNs for microscopic HFLI unmixing. By incorporating apparatus-dependent settings, such as number of time-points, total time-window, number of spectral channels, varying noise-models, etc. (further detailed in Appendix: Section 1 and [14]), future studies will expand upon the presented unmixing workflow to explore and validate its use in microscopic and spectroscopic applications, among others.
Acknowledgments
We gratefully acknowledge the support of NVIDIA Corporation with the donation of the Titan Xp GPU and Genentech, Inc for donating the Trastuzumab. We would like also to acknowledge the support of Drs Margarida Barroso and Alena Rudkouskaya in providing the animal model as well as the conjugated probes along with Dr. Pingkun Yan and Mr. Robert Culibrk for helpful discussion.
Appendix
Appendix Section 1. Data Simulation Workflow
Simulating application-specific hyperspectral FLI data
As was discussed briefly, the simulation routine developed for this work, which has been validated only for HMFLI unmixing to date, is detailed in great depth on our GitHub repository https://github.com/jasontsmith2718/UNMIX-ME (along with corresponding data, relevant script, etc.), but will be described in brief here.
To generate experimentally realistic hyperspectral FLI data through this approach, one must have the following:
-
-
Pure emission spectral profiles of each fluorescent specie comprising the sample.
-
-
Each fluorophore’s lifetime (known within +/- 100 ps).
-
-
Instrument Response Function ) of the HFLI apparatus.
At the start of every simulation iteration, an MNIST (Modified National Institute of Standards and Technology database) binary figure is chosen at random. This figure is subsequently downsampled by a factor of two (3232 → 1616) and used for subsequent value assignment. At every non-zero pixel, values of lifetime (τ) are assigned at random – with the (example for four-lifetime case illustrated in Fig. 7). Each pixel is also assigned individual spectral profiles (all initially max-normalized) which are immediately multiplied by a random scalar value between 50-500 and assigned to specie-specific pre-allocated arrays of size (). Next, performing a loop over all non-zero pixels, a random value between zero and one is obtained in order to select a combination of fluorescent species to include (the total number of which is always equal to ). Afterwards, a nested loop generates TPSFs () across all 16 channels via Eq. (3).
| (3) |
where I indicated the scalar intensity value of the nth fluorophore at each channel. This is performed n times to account for all fluorophores, simulating a total of n TPSFs – each of which undergo a collective sum (including all n TPSFs) followed by Poisson noise assignment. To account for potential system-dependent laser jitter, randomly selected TPSFs are shifted around their final position (+/- three integer values). This 16-TPSF generation repeats for all non-zero values across the image. Concurrently, values of one are assigned to an array initialized with all zeros of size () to indicate the fluorophores present at each pixel.
Next, ground-truth (G.T.) coefficient values are obtained (example illustration shown Fig. 7(h-k)), possessing size (). By summing over the fourth dimension of the 16-channel mono/multi-specie TPSF data, continuous wave (CW) data possessing size () were calculated. Afterwards, iterative intensity-based spectral unmixing was performed at each non-zero-pixel location via Eq. (1) using with each pure emission spectral profile (max-normalized ex. illustrated in Fig. 7(a)) to obtain values for c. For the case of multiple species possessing the same emission profile, the coefficient value obtained through the simplistic intensity-based technique is further multiplied by a ratio of the maximum value of each specie’s initially assigned pre-allocated spectral profile over the sum of all maximum intensity values possessing the same emission profile (a maximum of two values per spectra in this report). Finally, to obtain true G.T. values and ensure that the network is trained to map spectral bleed-through to zero, the array of obtained coefficient values is multiplied by the binary array used to keep track of fluorophore presence at each () location. This single matrix dot product zeros out all non-contributing coefficient values and is the reason behind the sparsity illustrated in Fig. 2, Fig. 3, and Fig. 7.
Fig. 7.
Information relevant for a two-spectra (a), four-specie (d-g) in silico spectral lifetime unmixing performance assessment. Example mono-specie HFLI data (b) along with an example containing a mix of all four (c) is given for illustrative purpose. Blue and red boxes indicate the spectra (a) to which each of the lifetime and coefficient (h-k) values belong.
Correction in the case of resonance energy transfer
The nonradiative RET phenomena occurs when two conditions are satisfied: 1) the emission and excitation spectra of two fluorescent species overlap, 2) both fluorophores are oriented in a particular fashion relative to each other and are in close proximity (within < 10 nm). Spectral unmixing of fluorescent species undergoing Resonance Energy Transfer (RET) is a particularly special case which necessitates correction via fluorophore-specific photophysical values to obtain accurate quantification. Correcting for RET during unmixing has been conventionally performed using the following expression Eq. (4) [16].
| (4) |
where a, c, E and correspond to the spectral profile, abundance coefficient, quantum yield (with T, D and A notating total, donor and acceptor), FRET efficiency and the ratio of pure donor over pure acceptor emission spectra, respectively. The spectra obtained for calculating were those collected from the wells containing only AF700 and AF750 during the well-plate HMFLI-FRET acquisition (Fig. 4).
By Eq. (4), conventional linear unmixing methods will underestimate the value of (by a factor of (1-E) and overestimate by a factor of – the results of which were observed in both Fig. 4 and Fig. 5/6 using LSQ + F. Thus, during the step of obtaining the fractional abundance coefficient, these values (either quickly found in literature ) [17] or calculated directly ()) for the AF700/AF750 NIR-FRET pair were used for abundance coefficient correction. By training UNMIX-ME to map directly to RET-corrected AF700FRET ( 0.3-0.45)ns, AF700non-FRET ( 0.95-1.1)ns and AF750 ( 0.5-0.65)ns, the spectral lifetime unmixing results presented herein were obtained. Given that the model presented herein utilized NIR fluorescent species possessing analytically demanding sub-nanosecond lifetimes, adaptation of UNMIX-ME for commonly used visible FRET pairs should be trivial.
Appendix Section 2. Time domain reconstruction from single pixel CS-HMFLI:
The reconstruction process from single pixel data acquisitions to time domain (TD) reconstructions is accomplished through the inverse solving of: M(t) = P x(t) for the image x(t) of the sample plane across 256 time points, where M(t) represents the raw fluorescence decay profiles acquired per pattern P. The pattern’s matrix serves to calculate the corresponding weights each measured pattern has for the sample plane image. Since the pattern’s matrix P and time domain measurement matrix M(t) are known, then through the use of TVAL3 [21] inverse solver, the fluorescence decay profiles per each pixel of the image sample plane, can be retrieved. To obtain continuous wave intensity images, the representations across the 256 time points can be added. In order to obtain lifetime reconstructions, each of the fluorescence decay’s per pixel are bi-exponential fitted through a least-squares based minimization algorithm. The bi-exponential mean lifetime model is represented by: (A1/100) τ1 + (A2/100) τ2 where A’s represent the FRETing Donor and Acceptor fraction and tau’s their respective lifetime values.
Appendix Section 3. UNMIX-ME DNN model: relevant metrics and interpretation
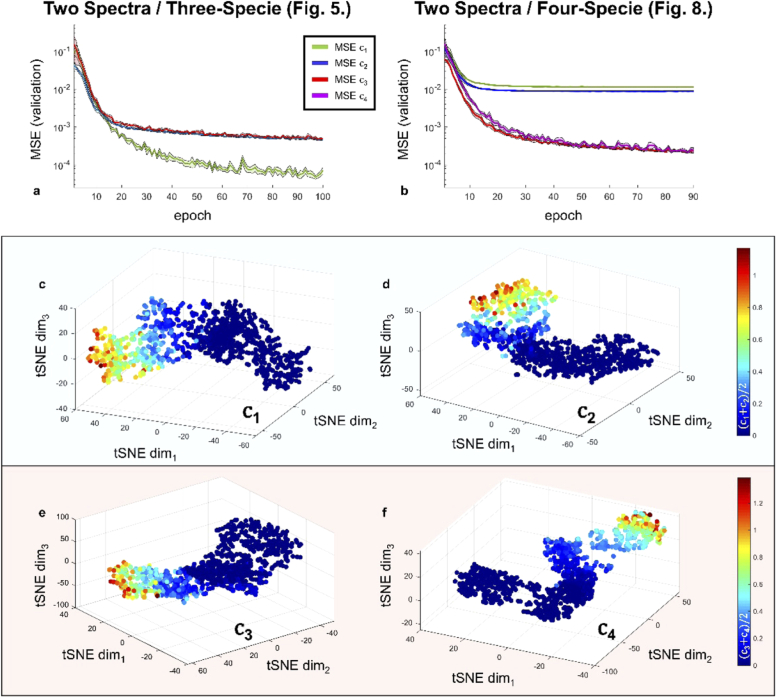
Figure 8(a) illustrates the validation MSE loss over 100 epochs averaged across five separate training cycles. Notably, the MSE loss of (green) converged to a much lower value other two (red and blue). This observation comes without surprise given that the retrieval of was obtained primarily through intensity-based unmixing in immense contrast to both and which share the same emission profile and both possess sub-nanosecond lifetimes differing by an average of just 0.3 ns.
Fig. 8.
Metrics relevant to the UNMIX-ME deep convolutional neural network. The MSE validation loss curves were obtained for each coefficient separately over five separate training iterations for two separate cases - two-spectra, three-lifetime (Fig. 3) and two-spectra, four-lifetime (Fig. 8). The average and standard deviation of each is provided (a, b). Four the two-spectra/four-specie case, 1,000 separate samples were generated and fed into the network in order to perform a t-SNE assessment of each branch individually (c-f).
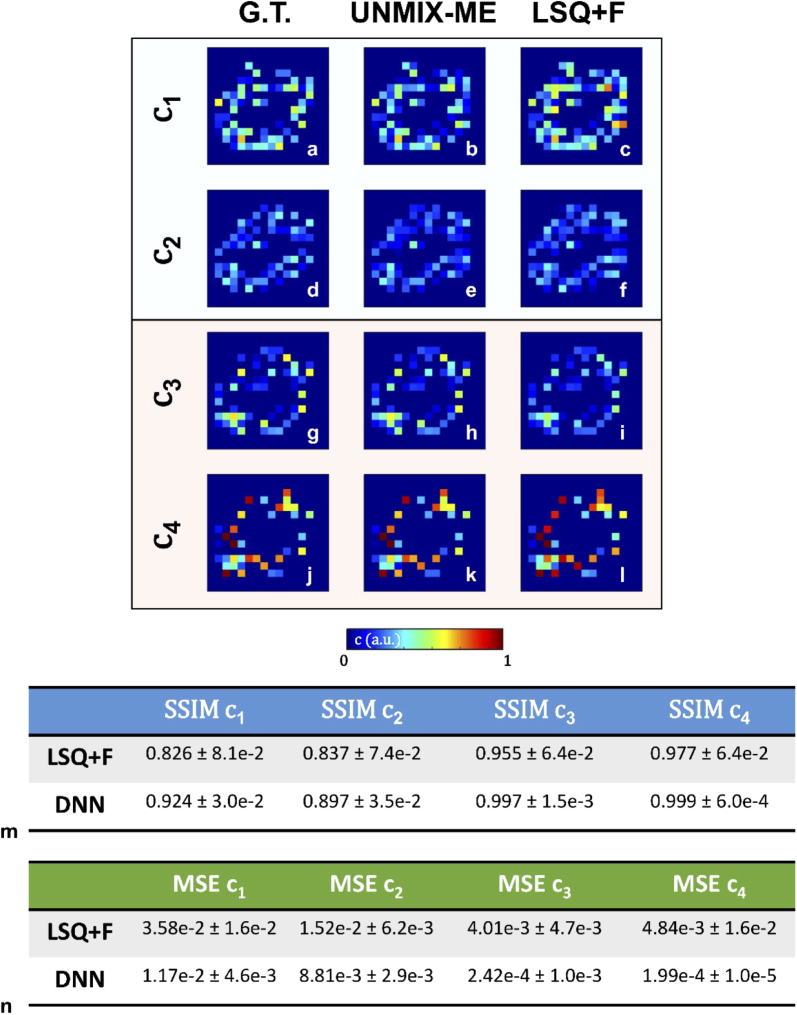
Further, Fig. 8(b) illustrates the validation MSE loss over 90 epochs averaged across five separate training cycles for a two-spectra, four-specie case (results shown in Fig. 8). Comparatively, not a single loss value gets anywhere near the previously mentioned lowest MSE obtained through Fig. 8(a) Since, in this case there would be no way to perform spectral unmixing via intensity alone, this observation supports one’s intuition that UNMIX-ME would experience greater difficulty in learning the inverse mapping in a much more complicated scenario. Additionally, the MSE validation loss for both and is significantly lower than the MSE of and . Though both spectral profiles are similar (evidenced by Fig. 7(a)), the lifetime values for the () pair, ([0.5-0.6] ns, ([1.0-1.1] ns) is significantly closer than that of the () pair ([0.25-0.35] ns, ([1.5-1.6] ns) and thus the inverse mapping is understandably more challenging to undertake for the first pair than the second. This is further supported by Fig. 9(m, n) which present stark differences in both SSIM and MSE performances between the fluorescent pairs. Though, in all cases presented herein, UNMIX-ME performs exceedingly well.
Fig. 9.
Spectral lifetime unmixing performance obtained via both LSQ + F and UNMIX-ME versus ground-truth. A single illustration is given for qualitative assessment. Both SSIM (m) and MSE (n) were calculated for 250 test samples to provide quantification with regards to image-to-image similarity and direct one-to-one value comparison.
Figure 8(c-(f)) provides the t-distributed Stochastic Neighbor Embedding (tSNE)-reduced 3D projection of flattened DNN activations extracted at the mid-way point within each of the four separate branches during the forward-pass of 1,000 test datasets. These data, generated with the same two-spectra/four-specie parameters as those employed in Figs. 7–9, were each assigned just a single spectral pair and lifetime quartet at random instead of spatially-independent assignment. As can be observed from each coefficient’s t-SNE scatter plot (where each sphere represents a simulation data voxel) the color gradients, which indicate ground-truth mean-abundance values for both pairs, show clear continuity in all four cases. This provides further insight into the network’s capability for extracting these complex spectral and temporal features during inference.
Fig. 10.
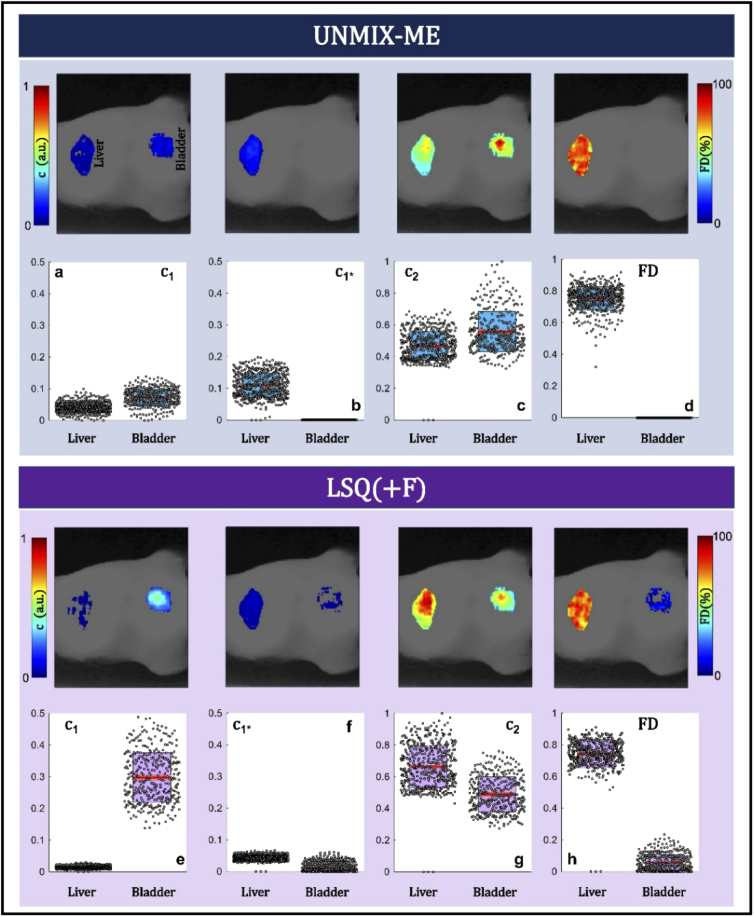
HMFLI-FRET imaging of Transferrin receptor (TfR) engagement in vivo. Results from UNMIX-ME (a-d) and LSQ + F (e-h) are provided. Resolved liver and bladder areas are displayed per reconstruction.
Appendix Section 4. In vivo HMFLI-FRET: Supplementary experiment – transferrin/transferrin receptor (Tf/TfR) engagement
HMFLI data was acquired from a nude athymic mouse after 6-hours post-injection with conjugated Transferrin (Tf) AF700 and AF750 FRET pair (in a 2:1, acceptor-to-donor ratio). Ideally the 2:1 acceptor to donor ratio must be represented by the abundance coefficients retrieved by UNMIX-ME or LSQ(+F). Previous in vivo work in mice has demonstrated the ability to characterize FRET engagement through conjugated Tf-probes in the liver and compare against the lifetime on the bladder [22]. The liver is known to display a high density of Transferrin receptors and thus possesses correspondingly high degrees of FRET when imaged [19]. However, the urinary bladder acts solely as an excretion organ, eventually accumulating free dye – possessing negligible potential for FRET occurrence. HMFLI data was acquired for over 12 minutes for a 64 × 64 resolution for 16 detection wavelengths (channels), using only 50% of the total required single pixel measurements. Therefore, resulting in a 4D input dataset of size 64 × 64 × 256 × 16.
Figure 10 reports the abundance coefficients and FRET percentage retrieved through both UNMIX-ME and LSQ + F (Fig. 10(a-d) and Fig. 10(e-h), respectively.) As previously encountered in vitro (Fig. 4) the LSQ + F methodology underestimates the AF700 abundance coefficient () in the liver (Fig. 10(f), FRET site), overestimates the AF750 abundance () in the bladder (Fig. 10(g), non-FRET site) and provides a non-zero FRET percentage across the urinary bladder in contrast to conventional knowledge. The FRET percentage retrieved at the liver ROI is in high agreement across both methods, as was also demonstrated previously at high-FRET wells (Fig. 4(j, t)). However, UNMIX-ME provides a total AF700 abundance in higher concordance with levels expected (Fig. 10(a, b)), FRET levels of zero in the urinary bladder (Fig. 10(d)) and an AF750 abundance trend that matches the expected 2:1 ratio closely across the liver ROI (Fig. 10(g)).
Fig. 11.
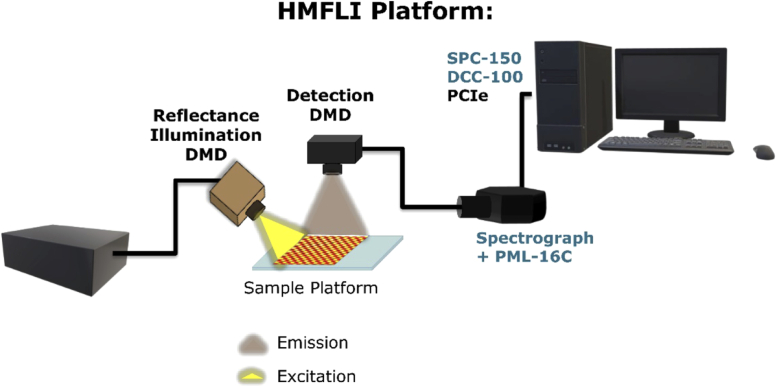
A detailed illustration of the Hyperspectral Macroscopic Fluorescence Lifetime Imaging (HMFLI) apparatus used for this work. An example depiction of the data acquired is given in Fig. 12.
Fig. 12.
Averaged HMFLI TPSF data at two different regions of the tumor xenograft (b). The regions were chosen due to their high (a) and low (c) FRET quantification.
Funding
National Institutes of Health10.13039/100000002 (R01 CA207725, R01 CA237267, R01 EB19443).
Disclosures
The authors declare no conflicts of interest.
References
- 1.Tsurui H., Nishimura H., Hattori S., Hirose S., Okumura K., Shirai T., “Seven-color Fluorescence Imaging of Tissue Samples Based on Fourier Spectroscopy and Singular Value Decomposition,” J. Histochem. Cytochem. 48(5), 653–662 (2000). 10.1177/002215540004800509 [DOI] [PubMed] [Google Scholar]
- 2.Zimmermann T., Marrison J., Hogg K., O’Toole P., “Clearing up the signal: Spectral imaging and linear unmixing in fluorescence microscopy,” Methods Mol. Biol. 1075, 129–148 (2014). 10.1007/978-1-60761-847-8_5 [DOI] [PubMed] [Google Scholar]
- 3.Pian Q., Yao R., Sinsuebphon N., Intes X., “Compressive hyperspectral time-resolved wide-field fluorescence lifetime imaging,” Nat. Photonics 11(7), 411–414 (2017). 10.1038/nphoton.2017.82 [DOI] [PMC free article] [PubMed] [Google Scholar]
- 4.Niehörster T., Löschberger A., Gregor I., Krämer B., Rahn H.-J., Patting M., Koberling F., Enderlein J., Sauer M., “Multi-target spectrally resolved fluorescence lifetime imaging microscopy,” Nat. Methods 13(3), 257–262 (2016). 10.1038/nmeth.3740 [DOI] [PubMed] [Google Scholar]
- 5.Coullomb A., Bidan C. M., Qian C., Wehnekamp F., Oddou C., Albigès-Rizo C., Lamb D. C., Dupont A., “QuanTI-FRET: a framework for quantitative FRET measurements in living cells,” Sci. Rep. 10(1), 6504 (2020). 10.1038/s41598-020-62924-w [DOI] [PMC free article] [PubMed] [Google Scholar]
- 6.Kremers G.-J., van Munster E. B., Goedhart J., Gadella T. W. J., “Quantitative Lifetime Unmixing of Multiexponentially Decaying Fluorophores Using Single-Frequency Fluorescence Lifetime Imaging Microscopy,” Biophys. J. 95(1), 378–389 (2008). 10.1529/biophysj.107.125229 [DOI] [PMC free article] [PubMed] [Google Scholar]
- 7.Ochoa M., Rudkouskaya A., Yao R., Yan P., Barroso M., Intes X., “Deep Learning Enhanced Hyperspectral Fluorescence Lifetime Imaging,” bioRxiv (2020). [DOI] [PMC free article] [PubMed] [Google Scholar]
- 8.Yao R., Ochoa M., Yan P., Intes X., “Net-FLICS: fast quantitative wide-field fluorescence lifetime imaging with compressed sensing – a deep learning approach,” Light: Sci. Appl. 8(1), 26 (2019). 10.1038/s41377-019-0138-x [DOI] [PMC free article] [PubMed] [Google Scholar]
- 9.Chollet F., “Deep Learning with Separable Convolutions,” arXiv Prepr. arXiv1610.02357 (2016).
- 10.Chollet F., “Xception: Deep Learning with Depthwise Separable Convolutions,” in 2017 IEEE Conference on Computer Vision and Pattern Recognition (CVPR) (IEEE, 2017), pp. 1800–1807. [Google Scholar]
- 11.He K., Zhang X., Ren S., Sun J., “Deep Residual Learning for Image Recognition,” in 2016 IEEE Conference on Computer Vision and Pattern Recognition (CVPR) (IEEE, 2016), pp. 770–778. [Google Scholar]
- 12.Smith J. T., Yao R., Sinsuebphon N., Rudkouskaya A., Un N., Mazurkiewicz J., Barroso M., Yan P., Intes X., “Fast fit-free analysis of fluorescence lifetime imaging via deep learning,” Proc. Natl. Acad. Sci. 116(48), 24019–24030 (2019). 10.1073/pnas.1912707116 [DOI] [PMC free article] [PubMed] [Google Scholar]
- 13.Beljonne D., Curutchet C., Scholes G. D., Silbey R. J., “Beyond Förster Resonance Energy Transfer in Biological and Nanoscale Systems,” J. Phys. Chem. B 113(19), 6583–6599 (2009). 10.1021/jp900708f [DOI] [PubMed] [Google Scholar]
- 14.Smith J. T., Ochoa M., “GitHub: “UNMIX-ME,”” https://github.com/jasontsmith2718/UNMIX-ME.
- 15.Abe K., Zhao L., Periasamy A., Intes X., Barroso M., “Non-Invasive In Vivo Imaging of Near Infrared-labeled Transferrin in Breast Cancer Cells and Tumors Using Fluorescence Lifetime FRET,” PLoS One 8(11), e80269 (2013). 10.1371/journal.pone.0080269 [DOI] [PMC free article] [PubMed] [Google Scholar]
- 16.Thaler C., Koushik S. V., Blank P. S., Vogel S. S., “Quantitative multiphoton spectral imaging and its use for measuring resonance energy transfer,” Biophys. J. (2005). [DOI] [PMC free article] [PubMed] [Google Scholar]
- 17.Rajoria S., Zhao L., Intes X., Barroso M., “FLIM-FRET for Cancer Applications,” Curr. Mol. Imaging 3(2), 144–161 (2015). 10.2174/2211555203666141117221111 [DOI] [PMC free article] [PubMed] [Google Scholar]
- 18.Rudkouskaya A., Sinsuebphon N., Intes X., Barroso M., “Role of Tumor Heterogeneity in Imaging Breast Cancer Targeted Delivery using FLIM FRET in Vivo,” in Biomedical Optics 2016 (OSA, 2016), p. CTh2A.5. 10.1364/CANCER.2016.CTh2A.5 [DOI] [Google Scholar]
- 19.Rudkouskaya A., Sinsuebphon N., Ward J., Tubbesing K., Intes X., Barroso M., “Quantitative imaging of receptor-ligand engagement in intact live animals,” J. Controlled Release 286, 451–459 (2018). 10.1016/j.jconrel.2018.07.032 [DOI] [PMC free article] [PubMed] [Google Scholar]
- 20.Ardeshirpour Y., Sackett D. L., Knutson J. R., Gandjbakhche A. H., “Using in vivo fluorescence lifetime imaging to detect HER2-positive tumors,” EJNMMI Res. 8(1), 26 (2018). 10.1186/s13550-018-0384-6 [DOI] [PMC free article] [PubMed] [Google Scholar]
- 21.Li C., “An Efficient Algorithm For Total Variation Regularization with Applications to the Single Pixel Camera and Compressive Sensing,” Rice Univ. (2009). [Google Scholar]
- 22.Chen S., Sinsuebphon N., Rudkouskaya A., Barroso M., Intes X., Michalet X., “In vitro and in vivo phasor analysis of stoichiometry and pharmacokinetics using short-lifetime near-infrared dyes and time-gated imaging,” J. Biophotonics 12(3), 653–662 (2019). 10.1002/jbio.201800185 [DOI] [PMC free article] [PubMed] [Google Scholar]


