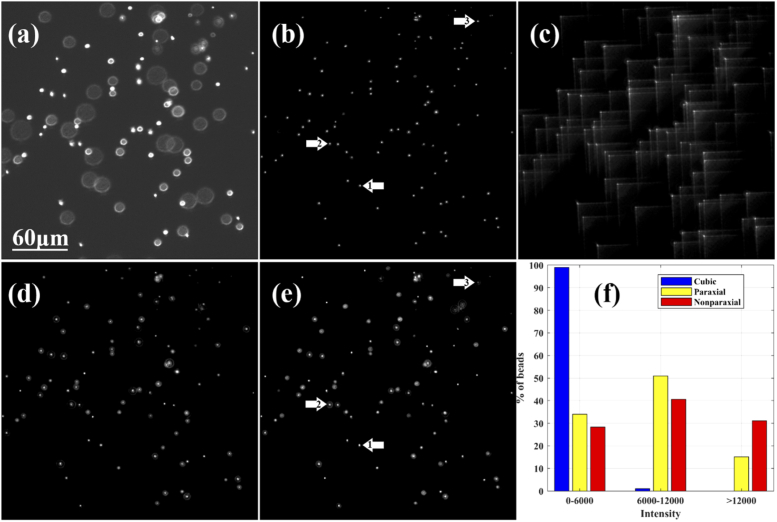
Fig. 6.
Imaging results of multi-layered beads. (a) Conventional imaging system. (b) Maximum-Intensity projections of the conventional axial scanning images. (c) The EDoF imaging system using cubic phase designs. (d) The EDoF imaging system using paraxial designs. (e) The EDoF imaging system using nonparaxial designs. (f) The percentage of fluorescent beads in different peak intensity ranges. Note that the images are stretched by contrast to show defocused beads. The arrows 1, 2 and 3 in (b) and (e) represent beads in the z plane of -20 , 0 , 10 .

