
FIGURE 15.
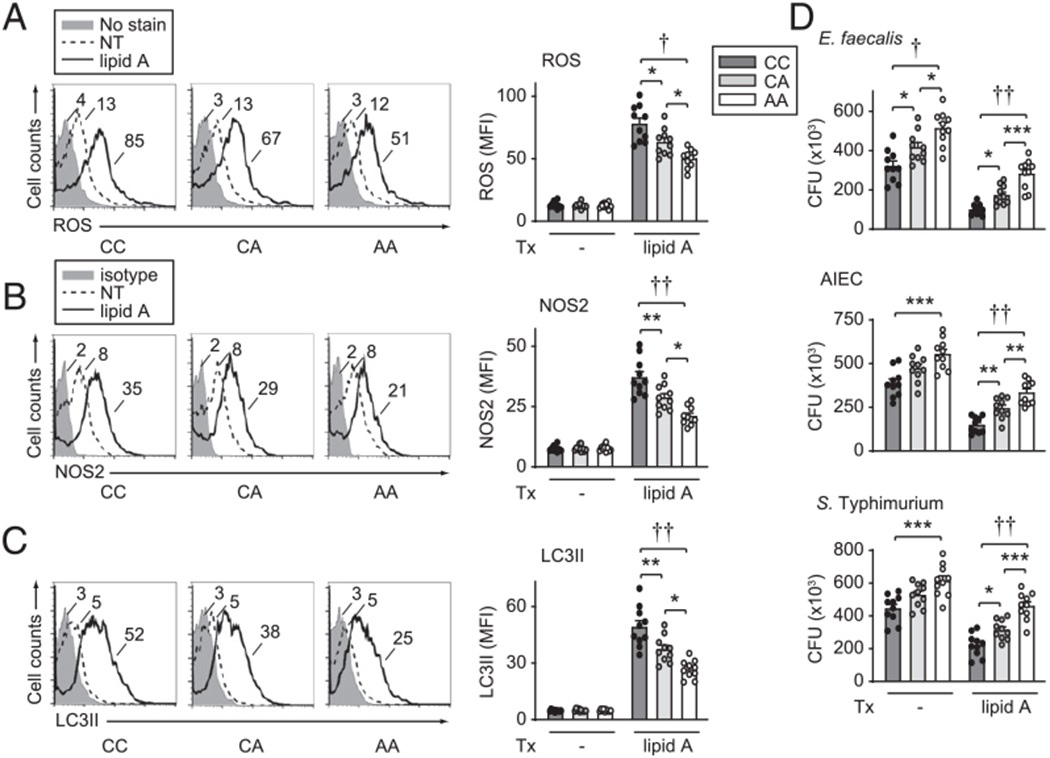
MDMs from rs1517352 CC disease risk carriers demonstrate increased intracellular bacterial clearance relative to AA carrier MDMs. Human MDMs from rs1517352 CC, CA, and AA carriers (n = 10 per genotype) were left untreated or treated for 48 h with 0.1 μg/ml lipid A. (A) ROS production. (B) NOS2 expression. (C) LC3II expression. Representative flow cytometry and summary graphs (mean fluorescence intensity [MFI]). (D) Intracellular bacterial clearance (CFU). Mean + SEM. Significance with one-way ANOVA with Tukey posttest. *p < 0.05, **p < 0.01, ***p < 0.001, †p < 1 × 10⁻⁴, ††p < 1 × 10⁻⁵. NT, no treatment; Tx, treatment.