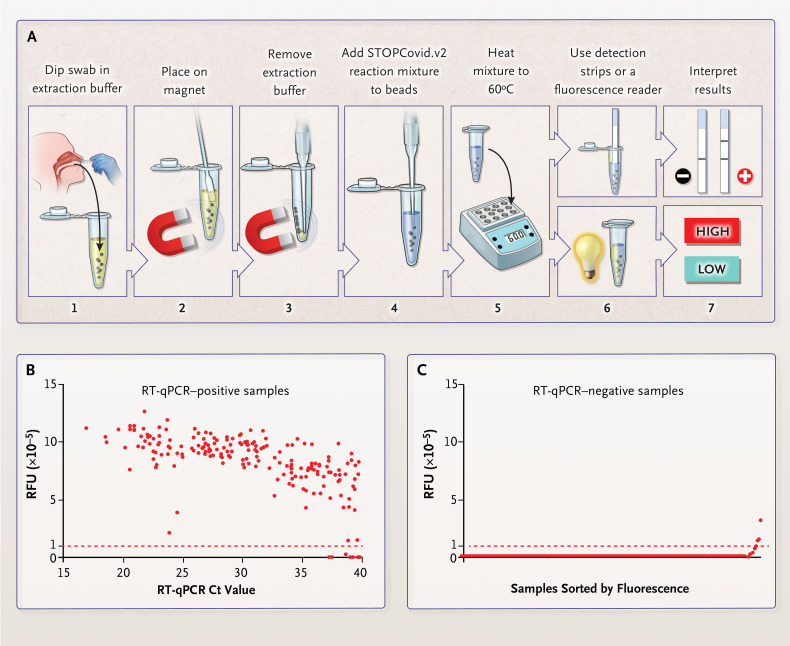
Figure 1. STOPCovid, Version 2 (STOPCovid.v2) Test and Performance Evaluation.
Panel A shows a nasopharyngeal or anterior nasal swab dipped in 400 μl of extraction solution containing lysis buffer and magnetic beads (step 1). After 10 minutes at room temperature, the sample was placed on a magnet (step 2) and extraction buffer was aspirated (step 3). A total of 50 μl of STOPCovid.v2 reaction mixture was added to the beads (step 4), and the sample was heated to 60°C (step 5). For a lateral-flow readout, after 80 minutes, detection strips were dipped into the reaction mixture (steps 6 and 7, top). After 45 minutes, a fluorescence reader was used to measure the fluorescence of the reaction mixture (steps 6 and 7, bottom). Panel B shows STOPCovid.v2 results for 202 SARS-CoV-2–positive nasopharyngeal swab samples obtained from patients and detected by means of a fluorescence readout and measured in relative fluorescence units (RFUs). A swab with 50μl of viral transport medium was dipped into the extraction buffer. Cycle-threshold (Ct) values were determined with the use of standard reverse-transcription–quantitative polymerase-chain-reaction (RT-qPCR) assays. Each dot indicates one sample, and the red dashed line indicates the threshold above which samples were classified as positive. End-point fluorescence at 45 minutes is shown. Panel C shows STOPCovid.v2 results for 200 SARS-CoV-2–negative nasopharyngeal swab samples obtained from patients. The samples were sorted by means of end-point fluorescence and measured in RFUs. Each dot indicates one sample, and the red dashed line indicates the threshold for classifying samples.

