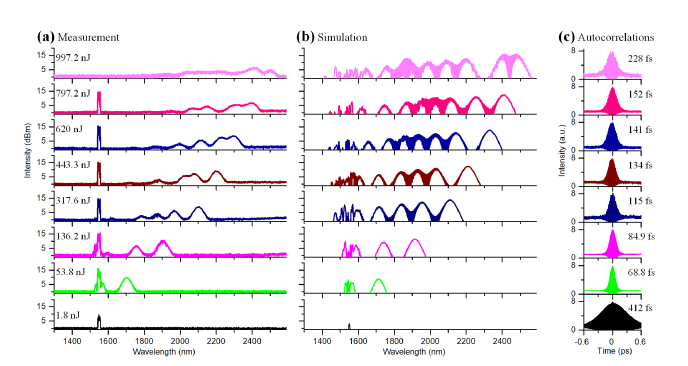
Fig. 3.
Measured (a) and simulated (b) spectra of SSFS in a 2-m-long LMA fiber. The input pulse energies given in (a) are already scaled by the coupling efficiency (64%). A 1720-nm LP filter is used to remove the residue 1550 nm light at the input pulse energy of 997.2 nJ. (c) Measured second-order interferometric autocorrelation of the input pulse (bottom) and the most red-shifted solitons. The pulse widths (FWHMs) are indicated in the plots using the deconvolution factor of 1.54 for sech2 intensity profile. For display purpose, the traces are offset along the vertical axis.

