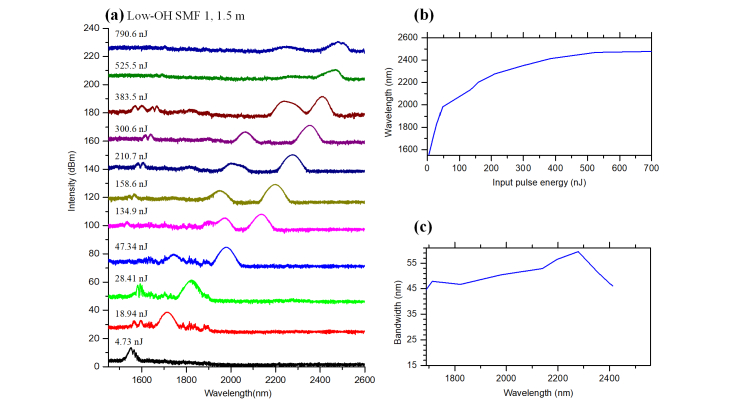
Fig. 7.
(a) Measured spectra of SSFS in the low-OH single mode fiber, with the input pulse energies before fiber coupling. For display purpose, the traces are offset along the vertical axis. (b) Center wavelengths of the most red-shifted solitons as a function of the input pulse energy before fiber coupling. (c) Bandwidths of the most red-shifted solitons at various soliton wavelengths.

