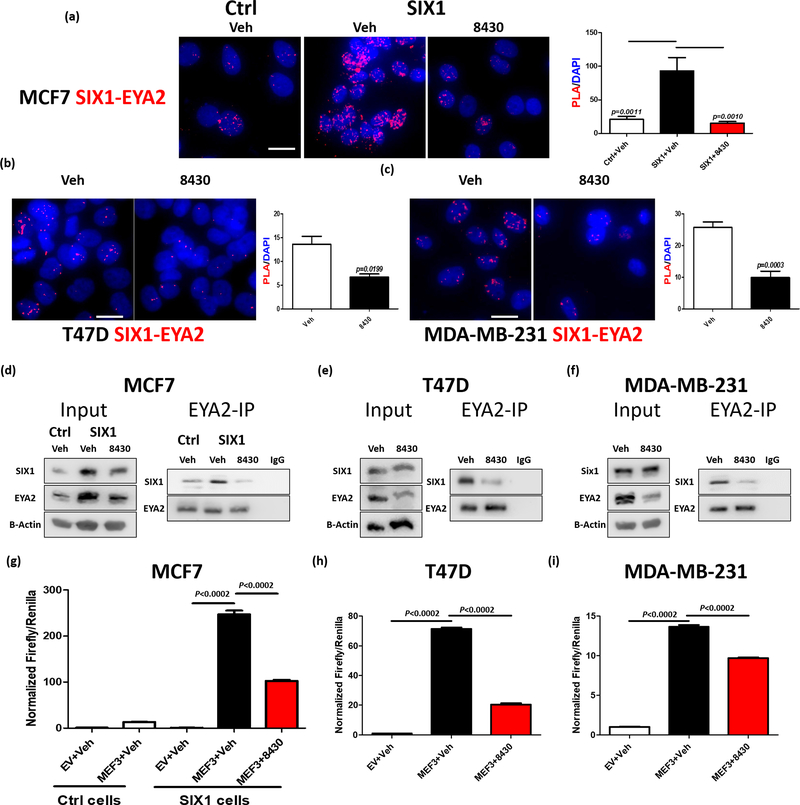
Figure 3. Compound 8430 disrupts SIX1-EYA2 interaction in breast cancer cells.
Representative images (n=4) of a Proximity Ligation Assay (PLA) assessing the SIX1-EYA2 interaction in MCF7-Ctrl and MCF7-SIX1 cells treated with vehichle (DMSO) or 10μM 8430 (a), T47D cells treated with vehicle or 20μM 8430 (b), and MDA-MB-231 cells treated with vehicle or 20μM 8430 (c). Scale bars=20μm. Graphs demonstrate the mean of PLA signal over the DAPI in representative experiments. Error bars represent standard deviation, and statistical significance was evaluated by one-way ANOVA followed by Tukey post adjustment (MCF7) or unpaired 2-tailed t-test (T47D and MDA MB 231), p values are listed with 4 decimal places. d-f. EYA2 Immunoprecipitation (IP) followed by Western Blot (WB) analyses. Representative images (n=3) of WBs demonstrate levels of SIX1 and EYA2 in input and in the EYA2-IP fractions in vehicle vs 8430 treated MCF7-Ctrl/SIX1 (d), T47D (e), and MDA-MB-231 (f) cells. 8430 was used at 10μM in MCF7 cells and at 20μM in T47D and MDA-MB-231 cells. To measure effect of 8430 on transcriptional activity, MEF3 Firefly/Renilla dual luciferase reporter assay was performed using MCF7-Ctrl, MCF7-SIX1, T47D, and MDA-MB-231 cells, treated with either vehicle or 8430. Normalized Firefly/Renilla luciferase signal from representative experiments (n=3) was plotted in MCF7-Ctrl or MCF7-SIX1 (g), T47D (h) and MDA-MB-231 (i) cells. Error bars are standard deviations, and statistical significance was evaluated by one-way ANOVA followed by Tukey post adjustment, p values are listed with 4 decimal places.

