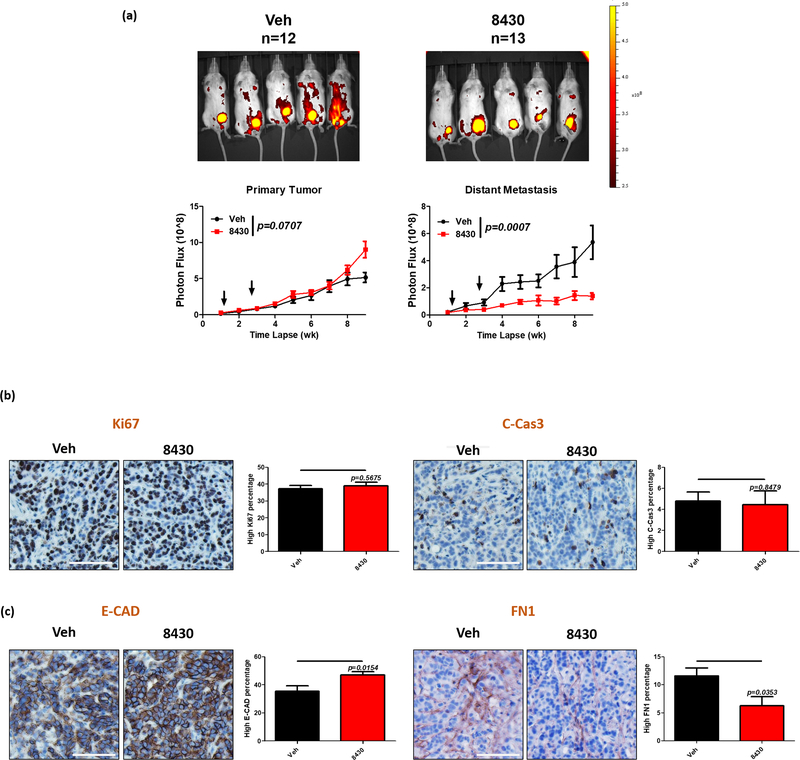
Figure 7. Compound 8430 inhibits metastasis of breast cancer cells expressing high levels of SIX1.
Mice carrying tRFP tagged MCF-SIX1 tumors were treated with either vehicle (NMP, PEG400 and 30% Solutol) or 25mg/kg of 8430 for 3 weeks (from day 3 to day 21). Primary tumors were harvested after week 9 for further immunohistochemical staining. a. Representative fluorescence images from week 9 are shown. Red fluorescence signal from primary tumors (left) and distant metastases (right) is quantitated and plotted over time in vehicle and 8430 treated mice. Arrows indicate the compound treatment duration. Error bars represent standard error of the mean, and statistical significance is assessed using a mixed-effects model. Representative IHC images for Ki67 (b. left), Cleaved Caspase 3 (b. right), E-CAD (c. left) and FN1 (c. right). Percentage of cells with high staining signal is plotted in bar graphs. Error bars represent standard error of the mean, and statistical significance was assessed using an unpaired 2-tailed t-test.

