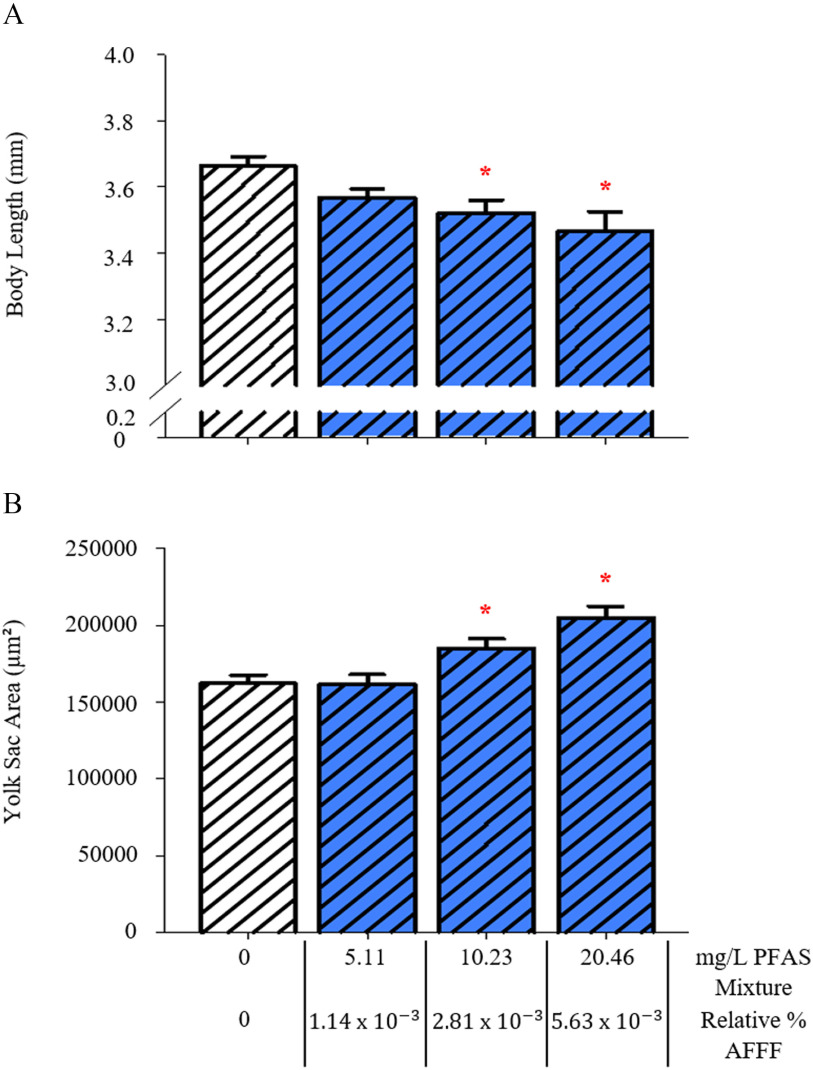
Figure 4.
Measurements of larval development with exposure to a perfluorooctanesulfonic acid/perfluorohexanesulfonic acid (PFOS/PFHxS) mixture, at a ratio consistent with the legacy AFFF sample (6.21:1, PFOS:PFHxS). Larval body length (A) and yolk sac area (B) are reported as total PFAS concentration of the mixture and the relative % AFFF those mixtures represent. Control larvae were exposed to a 0.01% v/v DMSO solution. Bars represent . Asterisk (*) indicate compared with PFAS mixture, one-way ANOVA, Tukey’s post hoc test, larvae per treatment group. Note: AFFF, aqueous film-forming foam; ANOVA, analysis of variance; PFAS, per- and polyfluoroalkyl substances; PFOS, perfluorooctanesulfonic acid; PFHxS, perfluorohexanesulfonic acid.

