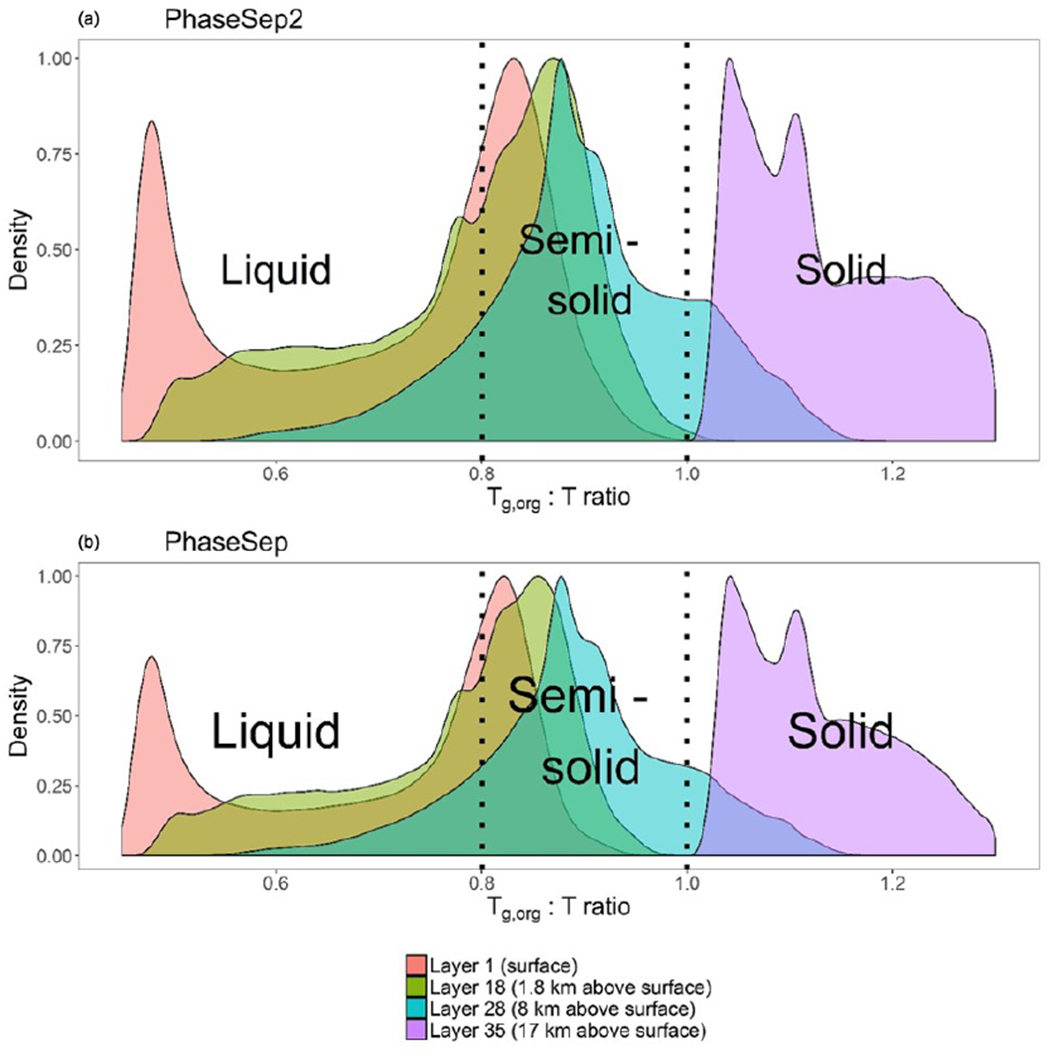
Figure 1.

Probability density distribution of glass transition temperature to ambient temperature ratio (Tg,org : T) for all grid cells and time steps for (a) the PhaseSep2 simulation and (b) the PhaseSep simulation at the surface layer (red), lower troposphere (green), upper troposphere (blue) and stratosphere (purple).
