Figure 10.

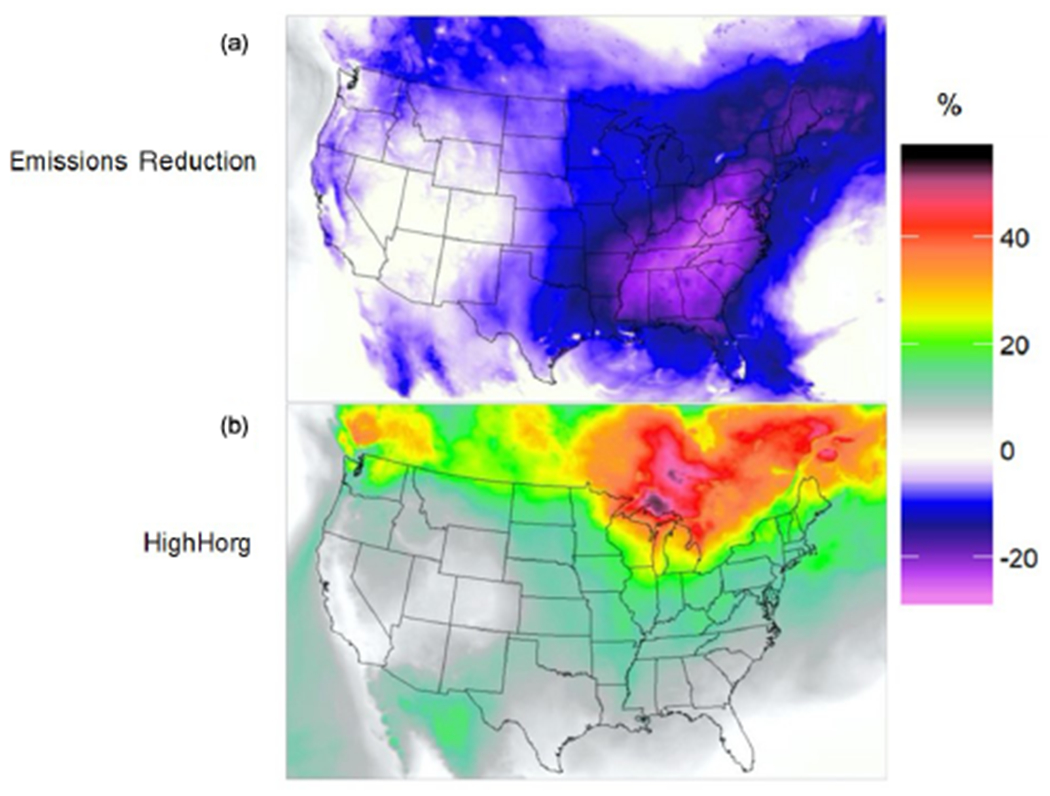
Relative change (%) in biogenic SOA mass at the surface level from the PhaseSep parameterization for the (a) NOx and SO2 Emissions Reduction sensitivity simulation and (b) HighHorg sensitivity simulation.

Relative change (%) in biogenic SOA mass at the surface level from the PhaseSep parameterization for the (a) NOx and SO2 Emissions Reduction sensitivity simulation and (b) HighHorg sensitivity simulation.