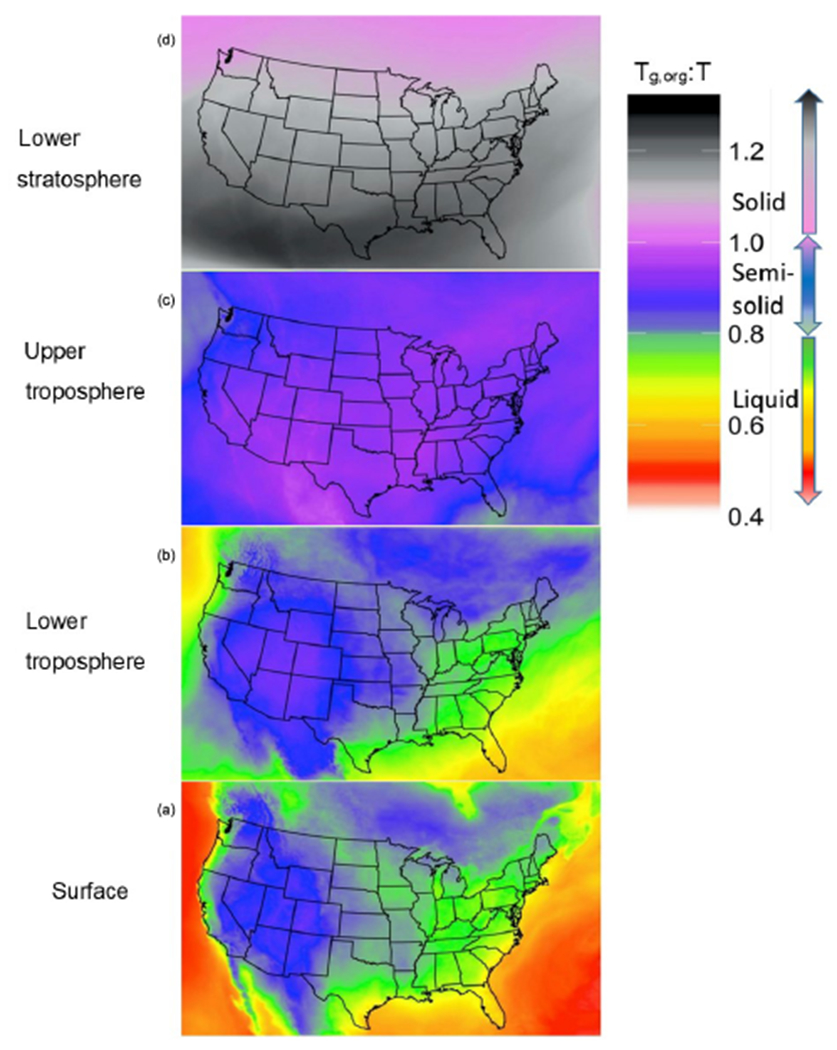
Figure 2.

For all time steps and over the continental United States, the average glass transition temperature to ambient temperature (Tg,org : T) ratio at (a) the surface level, (b) 1.8 km above the surface layer (lower troposphere), (c) 8 km above the surface layer (upper troposphere) and (d) 17 km above the surface layer (stratosphere) for the PhaseSep2 simulation.
