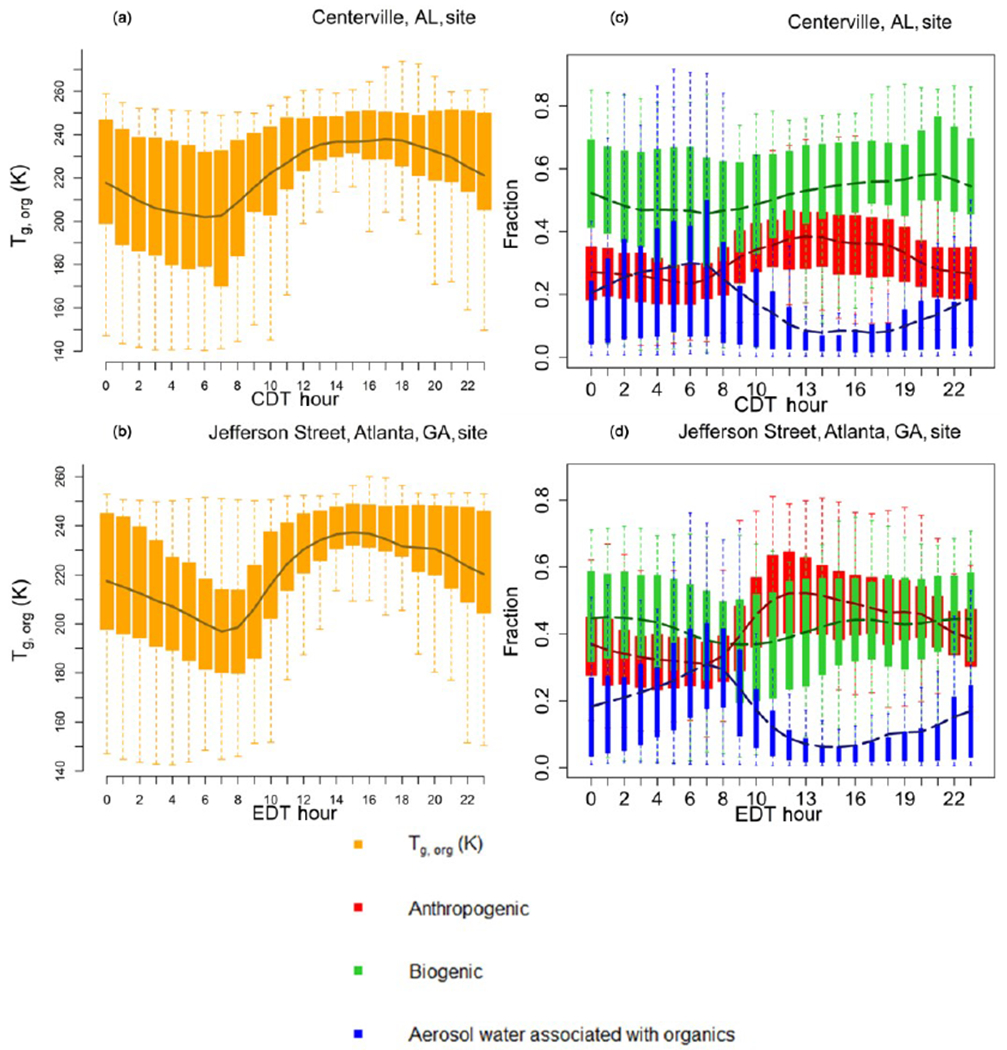
Figure 3.

Diurnal pattern for SOAS (1 June-15 July) 2013 of the organic glass transition temperature (Tg,org – orange), and contributions of anthropogenic OA (red), biogenic OA (green) and aerosol water associated with organics (blue) to Tg,org in the PhaseSep2 case at the (a, c) Centreville, AL, site and the (b, d) Jefferson Street, Atlanta, GA, site. Bars/shaded boxes indicate 25th to 75th percentiles. Extreme bounds of whiskers indicate 5th to 95th percentiles (i.e., 95 % confidence interval), and the line indicates the mean.
