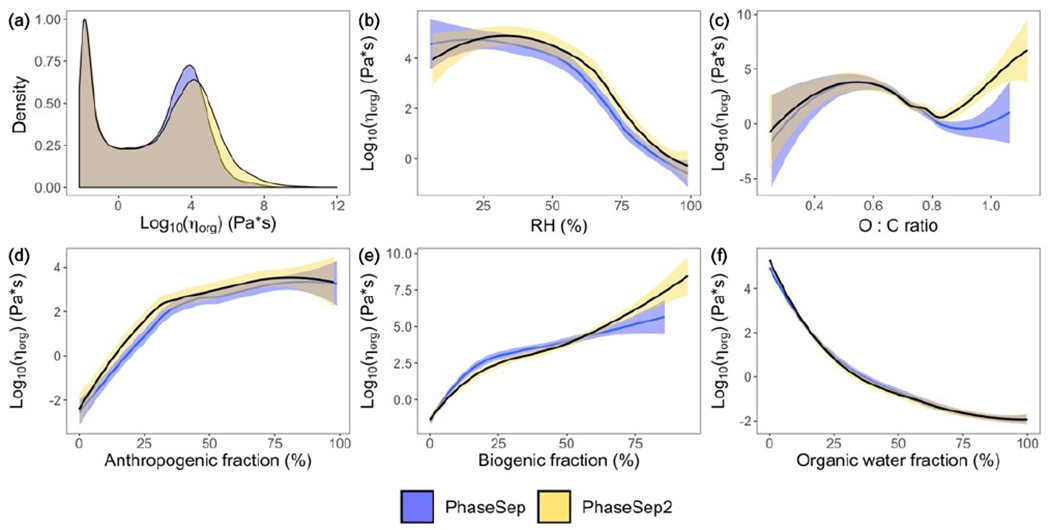
Figure 4.

For all grid cells and time steps at the surface layer, the (a) probability distribution of the organic-phase viscosity and correlations of particle viscosity (ηorg) with (b) relative humidity, (c) atomic oxygen to carbon (O : C) ratio, (d) anthropogenic SOA weight fraction, (e) biogenic SOA weight fraction and (f) organic-phase water content (ws) for PhaseSep (blue) and PhaseSep2 (gold).
