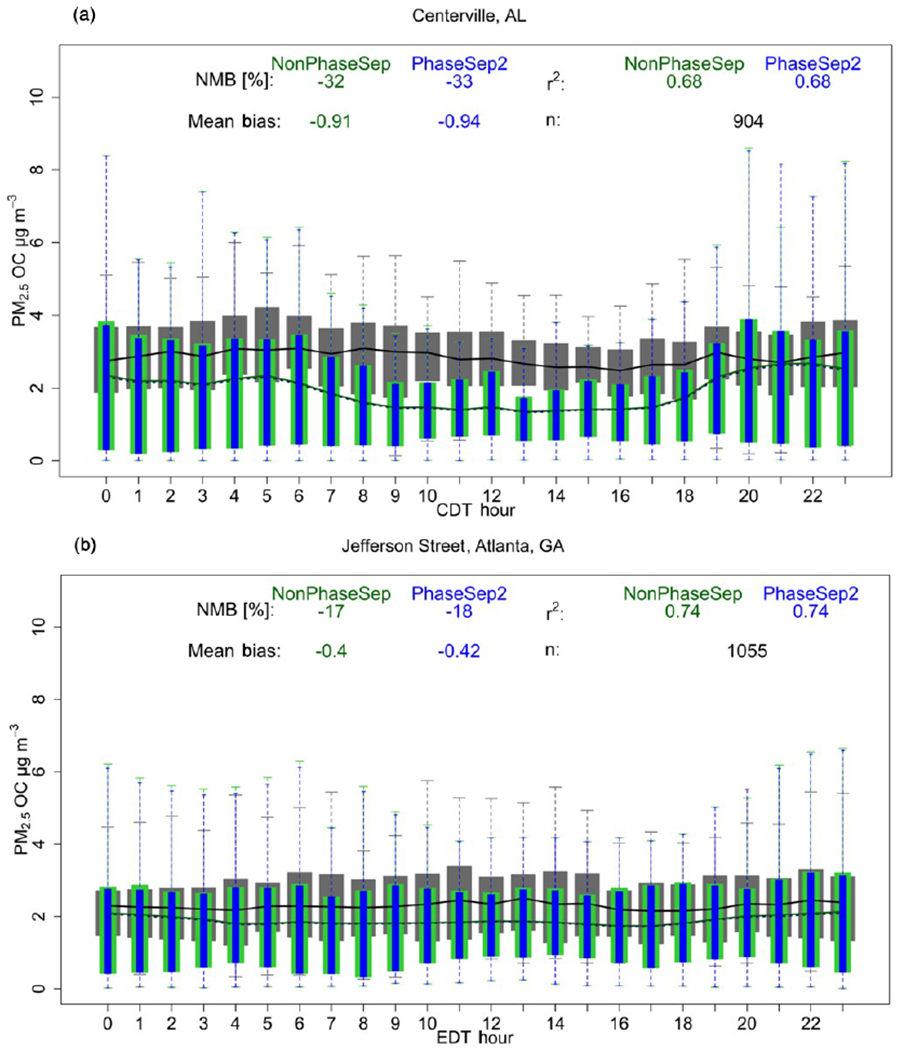
Figure 9.

PM2.5 organic carbon (OC) mass (μgm−3) as a function of hour of the day. Non-aggregated performance statistics – mean bias (μgm−3), % normalized mean bias (NMB) and Spearman’s correlation coefficient (r2) of NonPhaseSep (green) and PhaseSep2 (blue) cases relative to observed (grey) PM2.5 OC mass for the (a) rural Centreville, AL, site and (b) urban Jefferson Street, Atlanta, GA, site. Bars/shading indicate 25th to 75th percentiles. Extreme bounds of whiskers indicate 5th to 95th percentiles (i.e., 95 % confidence interval). Lines indicate means (dashed line indicates PhaseSep2). n is the number of observation points.
