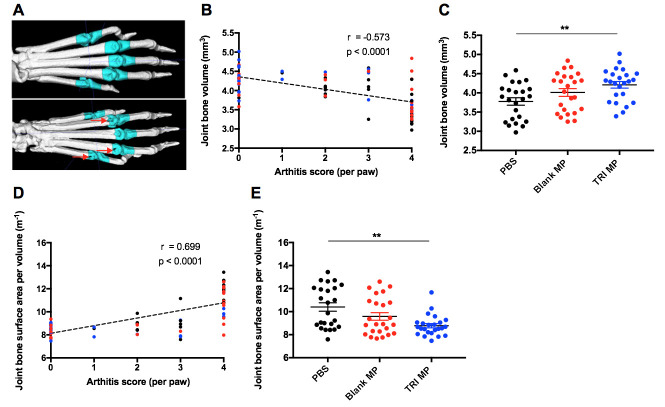
Fig 2. Lower arthritis score correlates with less bone erosion.
A) Representative 3D reconstructions of micro-CT scans showing a paw without bone erosion (top) and a paw with severe bone erosion (bottom). Joint masks indicated in cyan were the regions used to calculate joint bone volume. B) Joint bone volume versus arthritis score at Day 40 for individual hind paws. Color coded based on treatment group: black–PBS, red–Blank MP, blue–TRI MP. Spearman correlation coefficient and p value for correlation are indicated. C) Average joint bone volume by treatment group. D) Joint bone surface area to volume ratio versus arthritis score at Day 40 for individual hind paws. Color coded based on treatment group: black–PBS, red–Blank MP, blue–TRI MP. Spearman correlation coefficient and p value for correlation are indicated. E) Average joint bone surface area to volume ratio by treatment group. n = 24 paws (12 mice) per group, data presented as mean ± SEM, and the following cutoffs were used for significance: ** p < 0.01.

