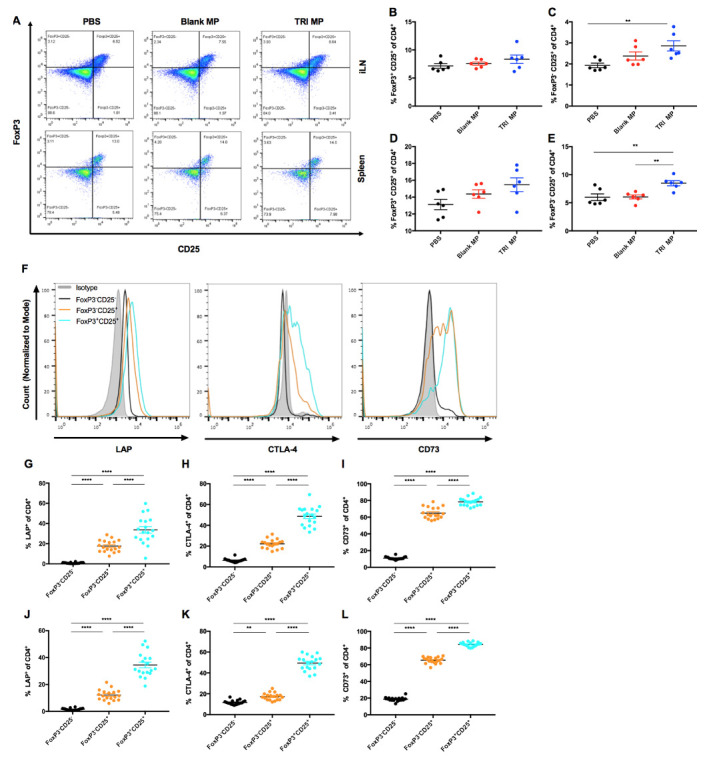
Fig 4. TRI MP leads to more CD25+FoxP3- T cells, which express elevated levels of LAP, CTLA-4, and CD73.

A) Representative pseudocolor plots of CD25 expression versus FoxP3 expression for CD4+ cells from the iLN (top row) or spleen (bottom row) of mice treated with PBS (left column), Blank MP (center column), or TRI MP (right column). B-E) Quantification of plots from A, showing percentage of CD4+ cells that are FoxP3+CD25+ (B, E) or FoxP3-CD25+ (C, D) by treatment group for the iLN (B, C) and spleen (D, E). F) Representative histogram plots of LAP (left), CTLA-4 (middle), and CD73 (right) expression for the isotype control (shaded gray), the FoxP3-CD25- population (black), the FoxP3-CD25+ population (orange), and the FoxP3+CD25+ (cyan) population (from a PBS treated mouse). G-L) Quantification of the percentage of CD4+ T cell populations that are LAP+ (G,J), CTLA-4+ (H, K), or CD73+ (I, L) relative to isotype control. Presented by CD4+ T cell population (FoxP3-CD25-, FoxP3-CD25+, and FoxP3+CD25+) for the iLN (G-I) and spleen (J-L). n = 6 mice per treatment group and n = 18 mice per CD4+ T cell population group, data presented as mean ± SEM, and the following cutoffs were used for significance: ** p < 0.01, *** p < 0.001, **** p < 0.0001.
