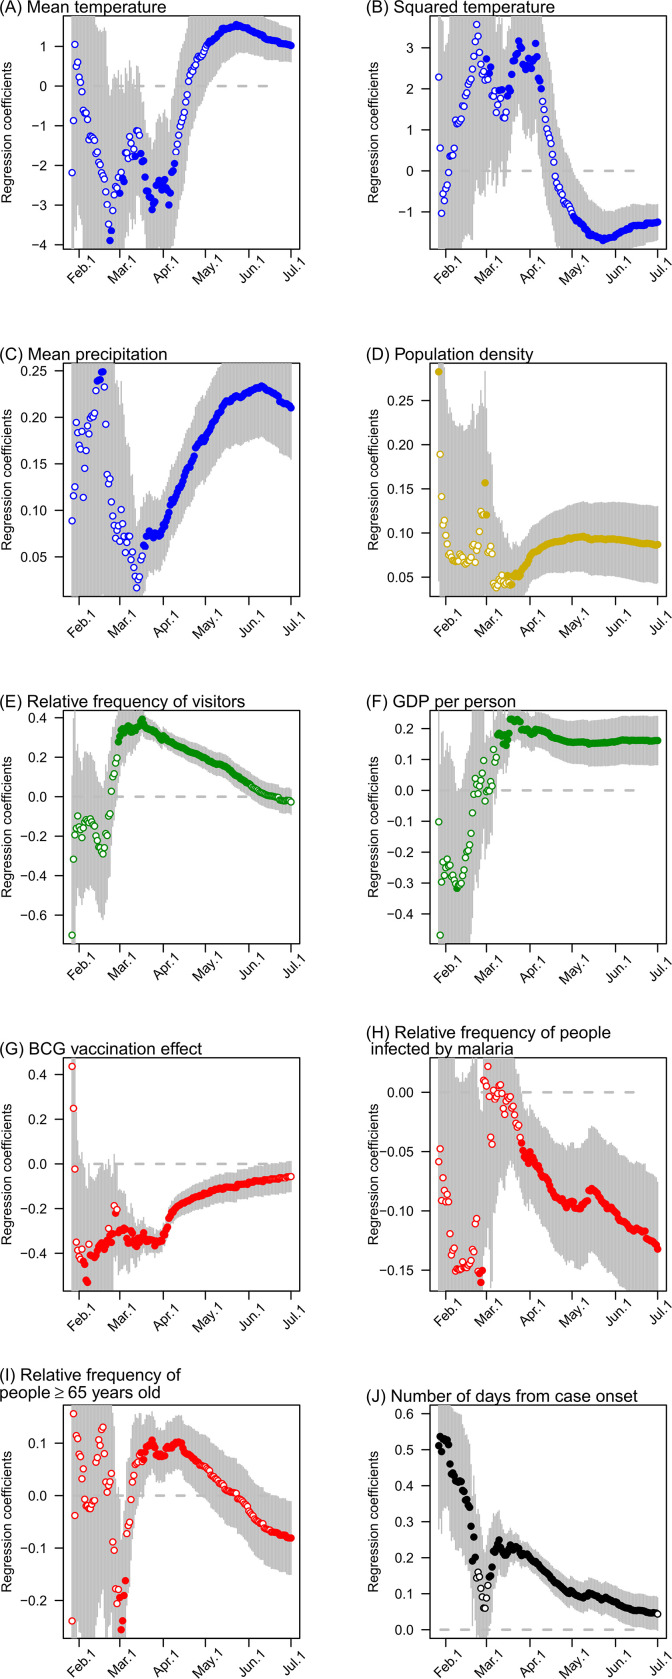
Fig 6. Time-series pattern of the standardized regression coefficients of the model explaining the cumulative number of COVID-19 cases (per 1 million population) from December 2019 to June 30, 2020.
Vertical lines represent the 95% confidence intervals of parameters. The results are based on data starting from January 2020 because the number of COVID-19 cases in December 2019 was insufficient for this analysis.

