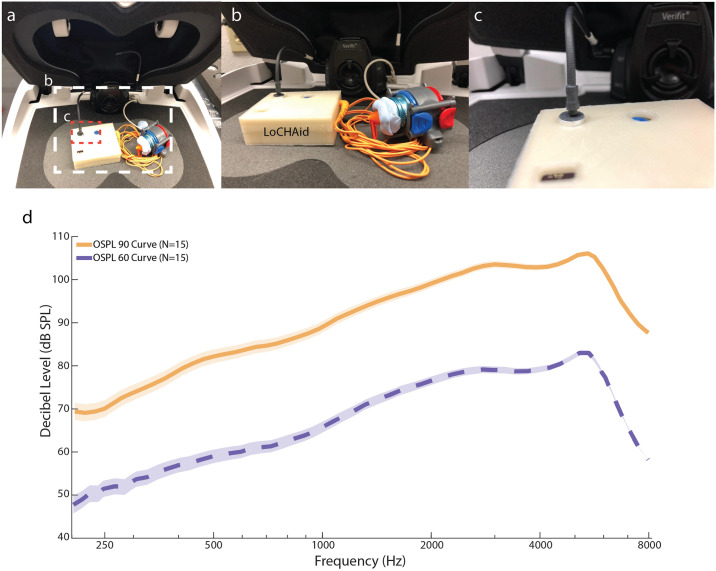
Fig 2. Electroacoustic parameter testing setup and results.
a. A view of the device setup in the test-box. b. This image shows the setup of the device inside the AudioScan Verifit Chamber for testing. The external output of the headphones is placed with putty onto a blue 0.2 cc-coupler which is then attached to the instrument receiver module. c. This shows the placement of the AudioScan speaker output within 1 mm relative to the microphone input of the LoCHAid.d. The graph shows the OSPL 90 and OSPL 60 curves for the device (N = 3 devices, n = 5 trials per device). There is less amplification in the lower frequencies (< 1 kHz), and more amplification in the upper frequencies (> 1 kHz).

