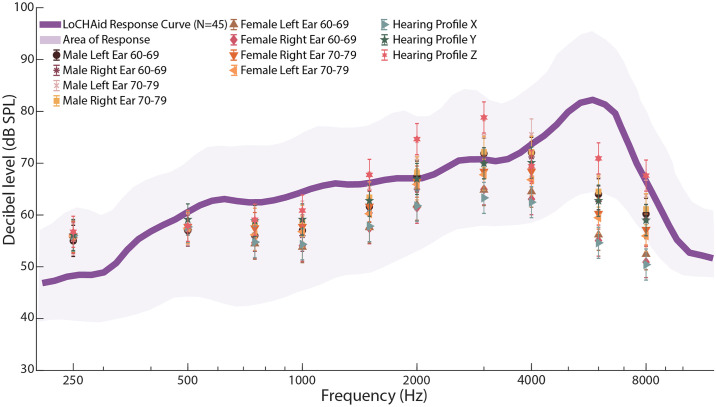
Fig 3. Audiometric fitting results by speechmap.
The graph shows the NAL-NL2 targets for 11 profiles. The purple line is the average response of the device on full on gain (no volume reduction) in response to ISTS 65 dB input; the shaded area of shows the range of response of the device to the input. The targets have a standard error of 3 dB SPL, which are shown in the error bars. The objective is for the purple line to go through the targets for the device to be fit to the profile. The device well incorporates the range of targets in its area of response, and the average response is well within 10 dB of the targets except for 6000 Hz. The data is taken from N = 3 devices, n = 15 trials. The reader is referred to S2 Fig in S1 File for quantification of fits for each profile, S9-S79 Fig and SI-SLX Tables in S1 File for individual profile targets and responses.

