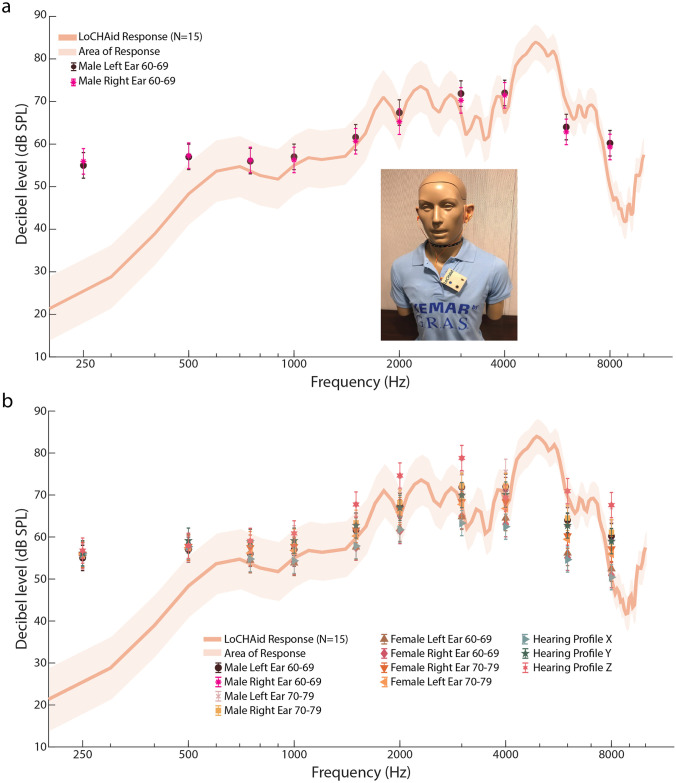
Fig 4. G.R.A.S KEMAR audiometric fitting results.
a. The graph shows the LoCHAid KEMAR Response with NAL-NL2 targets from profiles Males 60-69 Left and Right ears. The solid line shows the average response of the KEMAR real-ear (N = 1 device, n = 15 trials); the shaded area represents the standard deviation of the response. The NAL-NL2 targets for the profiles from SI Fig in S1 File are shown as well to see how well the KEMAR response fits the targets. The fits are better than the test-box simulations in Fig 3. Overall, the graph shows that the device very well fits the profiles within 5 dB SPL, except at lower frequencies. However, at lower frequencies, it is better to have less gain, as there is user complaint of hearing background noise. The inset image shows the setup of the LoCHAid with hearing buds on the G.R.A.S KEMAR Manikin of testing. b. The graph shows the NAL-NL2 targets for all 11 profiles with the response of the LoCHAid. The response is better matched to the targets in the KEMAR simulation as compared to the test-box Speechmap simulations, under both Loose and Strict Criteria—see Discussion in main text. The reader is referred to S9-S79 Figs and Tables I-LX in S1 File for individual profile targets and responses.

